Download
1 / 53
530 likes | 659 Views
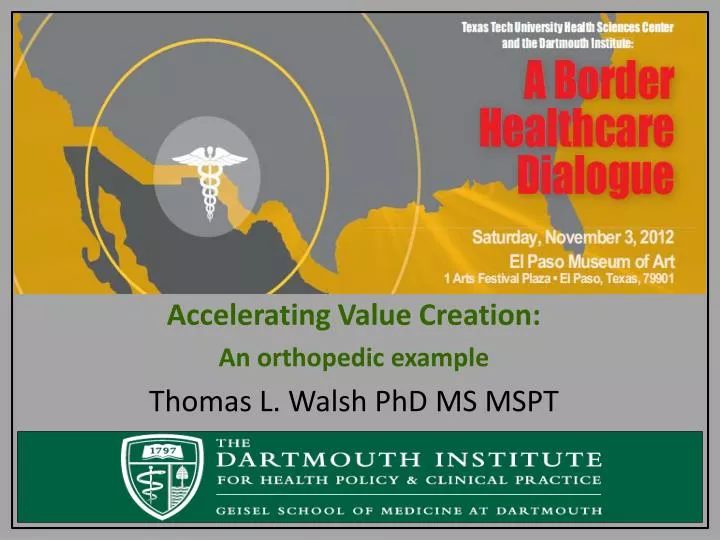
Accelerating Value Creation: An orthopedic example Thomas L. Walsh PhD MS MSPT. My Two Overarching Objectives. Start a relationship Learn El Paso secrets that could i mprove the Big Green Football team. Big Green. Red Raiders. CEO Dartmouth-Hitchcock Health System Jim Weinstein DO, MS.

E N D
Accelerating Value Creation: An orthopedic example Thomas L. Walsh PhD MS MSPT
My Two Overarching Objectives • Start a relationship • Learn El Paso secrets that could improve the Big Green Football team
Big Green Red Raiders
CEO Dartmouth-Hitchcock Health SystemJim Weinstein DO, MS “We must find a sustainable health system for patients, providers, payers, and our communities”
Healthcare Productivity in Theory & Practice Current outcome per dollar spent in clinical service line Provenefficacy Improved outcomes with more spending Real world effectiveness. All the added spending, but little or no observed improvement in outcomes. Fast & frugal options/Reverse Innovation bridge the Implementation Gap, achieve better outcomes at same or slightly higher spending D B The Implementation Gap Outcome A C Spending
The Value Equation Value = Patient Outcome Cost of Care
We need to design systems of care and inquiry to accelerate value creation
Clinically Relevant & Actionable Data to Support Vision Achievement • Real-time data in the clinic to improve quality of care for each patient • Measure outcomes / improvement for the Microsystem over time
Case 3 Case 2
Preference Diagnosis http://www.kingsfund.org.uk/publications/patients%E2%80%99-preferences-matter
Preference Diagnosis • Canadian surgeons identified patients “eligible” for knee replacement based on x-ray only • Of the fully informed sample, 15% wanted the procedure – Hawker 2001 • Doctors believe 71% of women with breast cancer rate “keeping my breast” as a top priority • 7% of women report “keeping my breast” as a top priority – Lee 2010
Preference Misdiagnosis • Well informed • men with prostate disease choose surgery 40% less often– Wagner 1995 • Patients with heart disease choose percutaneous intervention 20% less often – Morgan 2000 • Patients with disc herniation choose surgery 30% less often– Deyo 2000 • Patients with spinal stenosis choose surgery 30% more often– Deyo 2000
Two Types of Medical Errors Medical Error 1 – Sue tears her rightanterior cruciate ligament, but has her leftknee operated on Medical Error 2 – Joe has his right knee replaced then learns about alternative treatments and wishes he did not have the operation
Getting the Preference Diagnosis Right Meta Analysis of 86 RCTs demonstrating patients make better decisions when fully informed • More knowledgeable about the condition • Treatment more likely to be congruent with stated preferences • Less decisional regret • Stacy et. al. Cochrane Review 2010
Getting the Preference Diagnosis Right Group Health Experiment 2012 • emphasized the use of clinical data to ensure steps were taken to get the preference diagnosis correct
Nucleus Communications, Inc www.innerbody.com Anatomy of the Spine Center Patients 4th Quartile* 732 patients from 1/1/01 to 3/31/02 15%spine diagnosis in upper back(Occ to T10) Interesting Facts MCS 2.5% of US population are expected to score 30 or less 14.8% of Spine Center initial visit patients scored 30 or less 40.4% of the 4th Quartile scored 30 or less 53%spine diagnosis in lower back(T11 to Ileum) Herniated disc, also known as ruptured disc, is when a portion of the intervertebral disc material bulges and sticks out into the neural canal. Interesting Facts PCS 2.5% of US population are expected to score 30 or less 52.7% of Spine Center initial visit patients scored 30 or less 87.4% of the 4th Quartile scored 30 or less +8% Charges: One year episode spine specific ICD-9 codes 25% -8% The 4th Quartile patients are distributed evenly among departments for initial visit. Interesting Facts The 4th Quartile patients are 3 times more likely to participate in the Functional Restoration Program compared to the other patients. The 4th Quartile patients are almost 2 times more likely to have surgery compared to the other patients. Outcome: Difference between Follow-up and Initial. Follow-up was latest survey between 3 to 7 months (average 5 months between initial and follow-up surveys) Interesting Facts Charges The aim of this poster is to provide a forum to assist the Spine Center in interpretation of the collected data and to identify opportunities which can lead to improvements in access (matching supply and demand in the most efficient manner). This is the first part of thePractice Profile, Know your Patients. *4th Quartile is defined as 25% of the patients from entire cohort (N= 2,928) who scored the lowest on an average index of MCS and PCS from the SF-36 Health Status Survey, and Oswestry Disability Index from a spine disease specific survey that assesses disability (ODI converted to higher is better & 100 point scale).
Value = Patient Outcome Cost of Care
Healthcare Production Costs The amount it takes to pay personnel, rent, and for materials used to provide healthcare. • Charges • Institutional costs • Healthcare costs
Healthcare Population Spending The amount spent to reimburse providers of healthcare services & equipment. • Societal costs • Expenditures • Reimbursement • Healthcare costs
Population Spending on iPads is rising, but the Production Costs of tablets are not.
Bending Population Spending Requires Bending Production Costs $ Population Spending Estimates Based on Past Claims Current Production Costs New Production Costs Required to Maintain Margin Production Costs > Population Spending Operating Margin 4-10% Time
Founder of The Dartmouth Institute for Health Policy and Clinical Practice Jack Wennberg "Given the magnitude of the variations the possibility of too much medical care and the attendant possibility of illness that is caused by medical care is presumably as strong as the possibility of not enough service and unattended morbidity and mortality."
Distribution of Healthcare Spending Per Condition for Similar Patients Adapted from “Cowboys and Pit Crews” by Atul Gawande, The New Yorker. May 26, 2011
Implication Curves Match Reducing health care spending impairs quality
What the Data Tell Us Cost & Quality Curves Do Not Match Some Areas Provide Above Average Quality at Below Average Spending
Implication Curves do not match It is possible to reduce spending and improve quality
Types of Variation Beta blocker use among patients post heart attack varies from 5%-92%, when it should approach 100% 71% of doctors rate breast conservation as one of the top 3 concerns of woman diagnosed with CA while 7% of woman rate it similarly Two similar cities with similar populations – one has twice as many hospital beds.
Ratio of Rate in Highest to Lowest Spending Regions (risk-adjusted) 3.0 1.00 2.0 25 0.5 1.5 Effective Care (HEDIS measures) Reperfusion in 12 hours for AMI Aspirin at admission for AMI Mammogram, Women 65-69 Flu shot during past year, elderly Preference Sensitive Care Cataract Extraction Total Hip Replacement Total Knee Replacement Back Surgery SupplySensitiveCare Office Visits Inpatient Visits Initial Inpatient Specialist Consultations Chest X-ray Pulmonary Function Test Total Inpatient Days Inpatient Days in ICU or CCU Lower in High Spending Regions Higher in High Spending Regions
Q2 Q3 Q4 Q5 ColorectalCancer Q1 Q2 Q3 Q4 Q5 MyocardialInfarction Q1 Q2 Q3 Q4 Q5 Relative Risk of Death Across Quintiles of Spending Increased Risk Decreased Risk 1.00 1.05 1.10 0.95 Hip Fracture Q1 Q1 = Lowest spending HSA’s Q5 = Highest spending Fisher ES, Wennberg DE, Stukel TA, Gottlieb DJ, Lucas FL, and Pinder EL. The implications of regional variations in Medicare spending. Part 2: health outcomes and satisfaction with care. Annals of Internal Medicine, 2003. 138: 288-98.
Cost & Quality Curves Do Not Match Some Areas Provide Below Average Quality at Above Average Spending
Implication It is possible to reduce population spending and improve quality.
Healthcare Value Value = Patient Outcome Cost of Care
The Population Perspective Data within organizations – financial, operations, productivity – all point to increasing throughput & utilization to survive Relative Efficiency Comparisons – A Tale of Two Cities Larger perspective reveals a different perspective