Download
1 / 14
340 likes | 1.13k Views
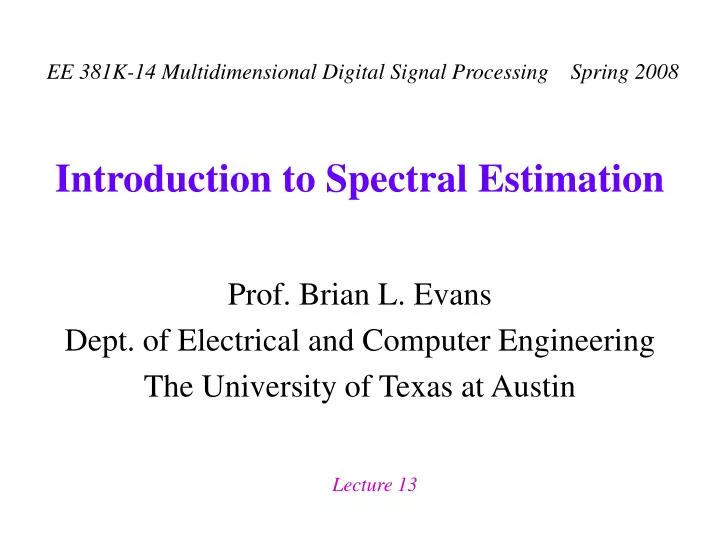
Introduction to Spectral Estimation. Outline. Introduction Nonparametric Methods Parametric Methods Conclusion. Introduction. Estimate spectrum from finite number of noisy measurements From spectrum estimate, extract Disturbance parameters (e.g. noise variance)

E N D
Outline • Introduction • Nonparametric Methods • Parametric Methods • Conclusion
Introduction • Estimate spectrum from finite number of noisy measurements • From spectrum estimate, extract • Disturbance parameters (e.g. noise variance) • Signal parameters (e.g. direction of arrival) • Signal waveforms (e.g. sum of sinusoids) • Applications • Beamforming and direction of arrival estimation • Channel impulse response estimation • Speech compression
Power Spectrum • Deterministic signal x(t) • Assume Fourier transformX(f)exists • Power spectrum is square of absolute value of magnitude response (phase is ignored) • Multiplication in Fourier domain is convolution in time domain • Conjugation in Fourier domain is reversal and conjugation in time autocorrelation
x(t) 1 0 Ts t rx(t) Ts -Ts Ts t Autocorrelation • Autocorrelation ofx(t): • Slide x(t)against x*(t)instead of flip-and-slide • Maximum value at rx(0) if rx(0) is finite • Even symmetric, i.e. rx(t) = rx(-t) • Discrete-time: • Alternate definition:
Power Spectrum • Estimate spectrum if signal known at all time • Compute autocorrelation • Compute Fourier transform of autocorrelation • Autocorrelation of random signal n(t) • For zero-mean Gaussian random processn(t)with variances2
Spectral Estimation Techniques Spectral Estimation Parametric Non Parametric Ex: Periodogram and Welch method AR, ARMA based Subspace Based (high-resolution) Model fitting based Ex: MUSIC and ESPRIT Ex: Least Squares AR: Autoregressive (all-pole IIR) ARMA: Autoregressive Moving Average (IIR) MUSIC: MUltiple SIgnal Classification ESPRIT: Estimation of Signal Parameters using Rotational Invariance Techniques Slide by Kapil Gulati, UT Austin, based on slide by Alex Gershman, McMaster University
Periodogram • Power spectrum for wide-sense stationary random process: • For ergodic process with unlimited amount of data: • Truncate data using rectangular window • N number of samples • wR(n) rectangular window approximate noise floor N = 16384; % number of samplesgaussianNoise = randn(N,1);plot( abs(fft(gaussianNoise)) .^ 2 );
Evaluating Spectrum Estimators • As number of samples grows, estimator should approach true spectrum • Unbiased: • Variance: • Periodogram (unbiased) • Bias • Variance • Resolution Barlett window is centered at origin and has length of 2N+1 (endpoints are zero)
Modified Periodogram • Window data with general window • Trade off main lobe width with side lobe attenuation • Loss in frequency resolution • Modified periodogram (unbiased) • Bias • Variance • Resolution • Cbw is 0.89 rectangular, 1.28 Bartlett, 1.30 Hamming Ew is normalized energy in window
Averaging Periodograms • Divide sequence into nonoverlapping blocks • K blocks, each of length L, so that N = K L • Average K periodogramsof L samples each • Trade off consistency for frequency resolution • Periodogram averaging (consistent) • Bias • Variance • Resolution
Averaging Modified Periodograms • Divide sequence into overlapping blocks • K blocks of length L, offset D: N = L + D (K - 1) • Average K modified periodograms of L samples each • Trade off variance reduction for decreased resolution • Modified periodogram averaging (consistent) • Bias • Variance • Resolution Assuming 50% overlap and Bartlett window
Minimum Variance Estimation • For each frequency wi computed in spectrum • Apply pth-order narrowband bandpass filter to signal • No distortion at center frequency wi (gain is one) • Reject maximum amount of out-of-band power • Scale result by normalized filter bandwidth D / (2 p) • Estimator
Minimum Variance Estimation • Data dependent processing • FIR filter for each frequency depends on Rx • Rx may be replaced with estimate if not known • Resolution dependent on FIR filter order p and not number of samples: • Filter order p • Larger means better frequency resolution • Larger means more complexity as Rx is (p+1) (p+1) • Upper bound is number of samples: pN