Download
1 / 21
290 likes | 727 Views
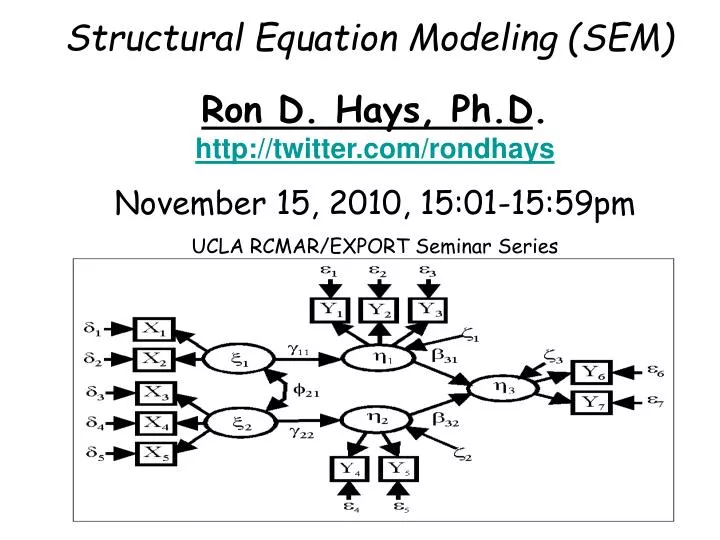
Ron D. Hays, Ph.D . http://twitter.com/rondhays November 15, 2010, 15:01-15:59pm UCLA RCMAR/EXPORT Seminar Series. Structural Equation Modeling (SEM). Acknowledgment of Support.

E N D
Ron D. Hays, Ph.D. http://twitter.com/rondhays November 15, 2010, 15:01-15:59pm UCLA RCMAR/EXPORT Seminar Series Structural Equation Modeling (SEM)
Acknowledgment of Support • UCLA Resource Center for Minority Aging Research/Center for Health Improvement in Minority Elderly (RCMAR/CHIME), P30AG021684. • UCLA/DREW Project EXPORT, 2P20MD000182
Example Wouters, E. Heunis, C. van Rensburg, D., & Meulemans, H. (2009). Physical and emotional health outcomes after 12 months of public-sector antiretroviral treatment in the Free State Province of South Africa: A longitudinal study using structural equation modelling. BMC Public Health 9: 103. http://www.ncbi.nlm.nih.gov/pmc/articles/PMC2678117/
X Y1 ε1i Y2 ε2i Path Analysis Y1 = α1 + β1X + ε1i Y2 = α2 + β2X + β3Y1 + ε2i
Fit Indices (> 0.94; <0.06 cutoffs) 2 2 - • Normed fit index: • Non-normed fit index: • Comparative fit index: null model 2 2 2 null - model null df df null model 2 null - 1 df null 2 -df 1 - model model 2 - df null null • Root Mean Square Error of Approximation: e.g.,
Methods (Public health sector in Free State Province of South African) • Baseline • <6 months of antiretroviral treatment (ART) • Follow-up • < 12 months ART • Variables • ART duration (independent variable) • Adverse effects of ART (None, Mild, Disruptive) • Do you have side effects? If yes, list them and tell us how disruptive they are? • Self-reported health (None, Some/moderate, Extreme) • EQ-5D mobility, usual activities, pain, and self-care (None, Some/moderate, Extreme) • EQ-5D anxiety/depression item, overall life satisfaction (5 response categories), global happiness item
Sample Characteristics • n = 268 at baseline (n = 234 at follow-up) • Mean age of 38 years (SD = 9) • 67% women • 40% reported some pain • 30% reported some anxiety or depression • 19% reported some • problems with walking about • problems with usual activities
e7 e9 e8 e6 e5 e4 e3 Mental Health F2 Physical Health F1 Original Wouters, E., Heunis, C. Von Rensberg, D., & Meulemens, H. BMC Public Health 2009,9:103. Sample of 234 patients enrolled in public sector antiretroviral treatment program in the Free State Province of South Africa Mobility V3 .787 ART Treatment Duration VI -.03 (NS) Usual Activities V4 .926 .829 -.08 (NS) Pain V5 -.38 .938 -.27 Adverse Effects V2 Self Care V6 .33 -.15 Life Satisfaction .730 .946 Global Happiness .798 Anxiety/ Depression Normed Fit Index= 0.985 Non-normal Fit Index= 0.993 Comprehensive Fit Index= 0.996 Root Mean Square of Approximation (RMSEA)= 0.031
EQS 6.1 for Windows Bentler, PM. (2006). EQS 6 Structural Equations Program Manual. Encino, CA: Multivariate Software, Inc. Normal theory estimators: ULS, GLS, ML Other estimators: ML robust, AGLS (ADF)
e7 e9 e8 e6 e5 e4 e3 Mental Health F2 Physical Health F1 ULS #1 Wouters, E., Heunis, C. Von Rensberg, D., & Meulemens, H. BMC Public Health 2009,9:103. Sample of 234 patients enrolled in public sector antiretroviral treatment program in the Free State Province of South Africa Mobility V3 .802 ART Treatment Duration VI -.050 (NS) Usual Activities V4 .927 .832 -.009 (NS) Pain V5 -.420 .928 -.293 Adverse Effects V2 Self Care V6 .388 -.064 (NS) Life Satisfaction .655 .917 Global Happiness .915 Anxiety/ Depression X2(n=234, dfs=23)=427.527 Normed Fit Index= 0.977 Non-normal Fit Index= 0.985 Comprehensive Fit Index= 0.990 Root Mean Square of Approximation (RMSEA)= 0.054
e5 e9 e8 e7 e6 e4 e3 Physical Health F1 Mental Health F2 ULS #2 Wouters, E., Heunis, C. Von Rensberg, D., & Meulemens, H. BMC Public Health 2009,9:103. Sample of 234 patients enrolled in public sector antiretroviral treatment program in the Free State Province of South Africa Mobility V3 .801 ART Treatment Duration VI Usual Activities V4 .926 .835 -.390 Pain V5 .926 -.272 Adverse Effects V2 Self Care V6 .411 Life Satisfaction .653 .911 Global Happiness .923 Anxiety/ Depression X2(n=234, dfs=26)=429.097 Normed Fit Index= 0.975 Non-normal Fit Index= 0.987 Comprehensive Fit Index= 0.991 Root Mean Square of Approximation (RMSEA)=0.050
e7 e9 e8 e6 e5 e4 e3 Mental Health F2 Physical Health F1 ML #1 Wouters, E., Heunis, C. Von Rensberg, D., & Meulemens, H. BMC Public Health 2009,9:103. Sample of 234 patients enrolled in public sector antiretroviral treatment program in the Free State Province of South Africa Mobility V3 .784 ART Treatment Duration VI -.045 (NS) Usual Activities V4 .933 .823 -.054 (NS) Pain V5 -.420 .947 -.288 Adverse Effects V2 Self Care V6 .391 -.105 (NS) Life Satisfaction .751 .895 Global Happiness .844 Anxiety/ Depression X2(n=234, dfs=23)=437.545 Normed Fit Index= 0.740 Non-normal Fit Index= 0.606 Comprehensive Fit Index= 0.748 Root Mean Square of Approximation (RMSEA)=0.278
e5 e9 e8 e7 e6 e4 e3 Physical Health F1 Mental Health F2 ML #2 Wouters, E., Heunis, C. Von Rensberg, D., & Meulemens, H. BMC Public Health 2009,9:103. Sample of 234 patients enrolled in public sector antiretroviral treatment program in the Free State Province of South Africa Mobility V3 .800 ART Treatment Duration VI Usual Activities V4 .859 .875 Pain V5 -.572 -.294 .898 Adverse Effects V2 Self Care V6 .344 Life Satisfaction .776 .855 Global Happiness .874 Anxiety/ Depression X2(n=234, 21)=94.465 Normed Fit Index= 0.944 Happiness with adverse effects & usual act. Non-normal Fit Index= 0.924 Self-care with usual activities Comprehensive Fit Index= 0.955 Dep/Anx with mobility & self-care Root Mean Square of Approximation (RMSEA)=0.123
================ Dear Dr. Hays Thanks for showing interest in my work. I am also glad that someone is interested in the statistical side of the story :-) I would not dare to call myself an SEM-specialist, but I really like the versatile nature of the technique. In the paper you cited I first used ML, but after the comments of a reviewer I re-ran the analysis using WLS because I have a rather small sample size. The results were similar. The results shown should be the ones from the WLS-analysis. Unfortunately, I changed computers after finishing my PhD, so I do not have the Lisrel-files anymore (I also do not use Lisrel anymore. I now use MPlus (because it can also handle dependent dichotomous variables)), but I certainly still have the raw dataset. If needed, I can try to reconstruct and rerun the analysis in MPlus, or even in Lisrel (I surely still have a copy of it somewhere). However, I am now preparing to go (and present) at the First Global Symposium on Health Systems Research in Montreux (15-19 Nov), so it may take a little while... Again thanks for your interest in my paper, Best regards, Edwin Dr. Wouters: Can you provide the LISREL output from the path model show in Figure 1? I am trying to figure out what estimation approach (e.g., ML) you used in fitting the model.
Summary • The longer the duration of ART treatment the less the adverse effects and (in turn) the better the health (physical and mental). • Duration has positive indirect effects on physical and mental health by reducing adverse effects
Thank you! http://assets.cambridge.org/97805217/81336/sample/9780521781336ws.pdf http://www.cob.unt.edu/slides/Paswan/BUSI6280/Anderson_Gerbing_1988.pdf Hays, R. D., Revicki, D., & Coyne, K. (2005). Application of structural equation modeling to health outcomes research. Evaluation and the Health Professions, 28, 295-309.