Download
1 / 45
450 likes | 561 Views
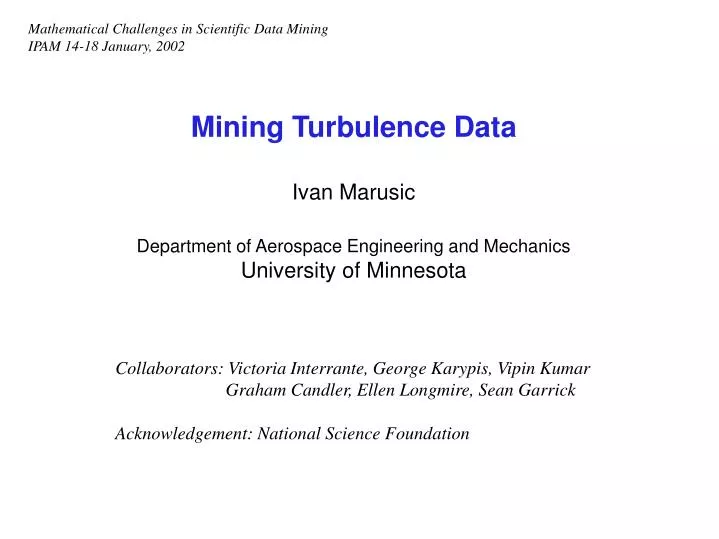
Mathematical Challenges in Scientific Data Mining IPAM 14-18 January, 2002. Mining Turbulence Data Ivan Marusic Department of Aerospace Engineering and Mechanics University of Minnesota. Collaborators: Victoria Interrante, George Karypis, Vipin Kumar

E N D
Mathematical Challenges in Scientific Data Mining IPAM 14-18 January, 2002 Mining Turbulence Data Ivan Marusic Department of Aerospace Engineering and Mechanics University of Minnesota Collaborators: Victoria Interrante, George Karypis, Vipin Kumar Graham Candler, Ellen Longmire, Sean Garrick Acknowledgement: National Science Foundation
Turbulent Boundary Layer (Flow visualization using Al flakes in water channel) Flow direction Solid surface
Outline • Turbulent boundary layers: introduction and background • Need for both simulation and experimental datasets • Visualization and feature extraction • What are the important features? • What is to be “data mined”? • Difficulties with present analysis approach • New analysis strategy to investigate causal relationships • Data mining issues and challenges
Turbulent Boundary Layer Flow direction Solid surface • Responsible for heat transfer, skin friction (drag), mixing of scalars
Issues in wall turbulence • Described by Navier-Stokes equations (non-linear PDEs) • Direct numerical simulation is restricted to low Re (Reynolds number) • Re = ratio of inertia to viscous forces (dUt/n) • No. of simulation grid points ~ (Re)9/4 , Cost ~ (Re)3 • Present simulation: Re = O(103), Require Re = O(106) • Also need experimental datasets to investigate high Re flows • Better understanding of physics/causal relationships would lead to more accurate modeled simulation tools (CFD) and analytical scaling laws
What features do we extract? • Flow field information involves in (x,y,z,t) : • Velocity u, Pressure p, Temperature q, etc • Good candidate = Coherent vortex structures
Volume rendered visualizations ( DNS data Re = 700) Enstrophy Decreasing threshold levels Discriminant
PIV SETUP Pulsed Lasers Nd:YAG Kodak Megaplus Cameras 1024 x 1024 pixels = 15
Typical Turbulent Boundary Layer Simulation • O(108) grid points • Generates >10 Terabytes per day (every day) • Write to disk every 1/1000 time steps (99.9% discarded) • Final database ~1 Terabyte • All analysis is done after final database is obtained
Some important trigger events associated with drag • “Bursting” • High values of Reynolds shear stress (-uw) • (associated with momentum transport)
Swirl (|lci|) Reynolds shear stress Vorticity Wall-normal velocity 20Apr_06 zone1
Consistent with “packets of vortices” (together with other evidence):
SIMPLE SEARCH ALGORITHM Dual threshold search routine Define connected region only if 8 neighboring points To search for ‘Packets of hairpin vortices’, define a region if Positive Vorticity in the bottom and Negative Vorticity in the top.. Additional search for (a) Low streamwise velocity (Low momentum) (b) High Reynolds shear stress in the adjoining region of patches of vorticity
MOMENTUM VORTICITY z+ = 92 All quantities non-dimensionalized using U and SWIRL STRENGTH
VORTICITY u’w’ z+ = 92 All quantities non-dimensionalized using U and
VORTICITY u’w’ MOMENTUM
Data Instance Graph Instance Object Vertex Object’s Attributes Vertex Label Relation Between Two Objects Edge Type Of Relation Edge Label Modeling Data With Graphs Beyond Transactions Frequent Subgraph Discovery (FSG – Karypis & Kuramochi 2001) • Graphs are suitable for capturing arbitrary relations between the various objects.
Interesting Patterns Frequent Subgraphs • Discovering interesting patterns • Finding frequent, recurrent subgraphs • Efficient algorithms must be developed that operate and take advantage of the new representation.
Problem setting: similar to finding frequent itemsets for association rule discovery Input Database of graph transactions Undirected simple graph (no loops, no multiples edges) Each graph transaction has labeled edges/vertices. Transactions may not be connected Minimum support threshold σ Output Frequent subgraphs that satisfy the support threshold Each frequent subgraph is connected. Finding Frequent Subgraphs:Input and Output
Example of datasets (Database type-B) for investigation using a Frequent Subgraph Discovery scheme: • PIV data : In-plane swirl S(x,y) for multiple timesteps • (with and without trigger signal) • - Full 3D data from simulation
Further Challenges • Temporally and Spatially evolving structures • (objects change) • Interactions of vortex structures
B A D C