1 / 11

Congestion Report

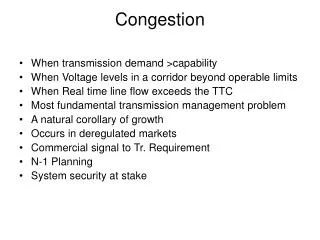
Congestion Report. Isabel Flores. Background . Provide trend of local congestion costs for last 12 months Costs shown in millions OOMC OOM Down LBE Down OOM Up LBE Up RPRS Top congested elements Inter-zonal costs - 2009. OOMC last 12 months - $M. OOM Down last 12 months - $M.

jeneil
Download Presentation

Congestion Report

An Image/Link below is provided (as is) to download presentation Download Policy: Content on the Website is provided to you AS IS for your information and personal use and may not be sold / licensed / shared on other websites without getting consent from its author. Content is provided to you AS IS for your information and personal use only. Download presentation by click this link. While downloading, if for some reason you are not able to download a presentation, the publisher may have deleted the file from their server. During download, if you can't get a presentation, the file might be deleted by the publisher.

E N D

Presentation Transcript


  1. Congestion Report Isabel Flores

  2. Background • Provide trend of local congestion costs for last 12 months • Costs shown in millions • OOMC • OOM Down • LBE Down • OOM Up • LBE Up • RPRS • Top congested elements • Inter-zonal costs - 2009

  3. OOMC last 12 months - $M

  4. OOM Down last 12 months - $M

  5. Balancing Energy Down last 12 months - $M

  6. OOM Up last 12 months - $M

  7. Balancing Energy Up last 12 months - $M

  8. Replacement Reserve last 12 months

  9. Top Overloaded Elements - February

  10. Top Overloaded Elements - March

  11. Inter-zonal Congestion Costs 2009 Settlement quality dollars.

More Related