Download
1 / 22
230 likes | 333 Views
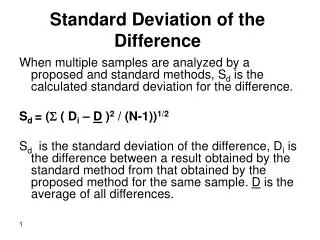
Find the mean number of points for the basketball team and the standard deviation. Inference Test of Difference of Means. Section 11.1. Experiment. Separate – boys & girls. Take Pulse rates. Remember…. Independent Selection of one sample does not influence the selection of the other sample.

E N D
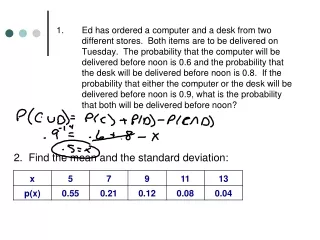
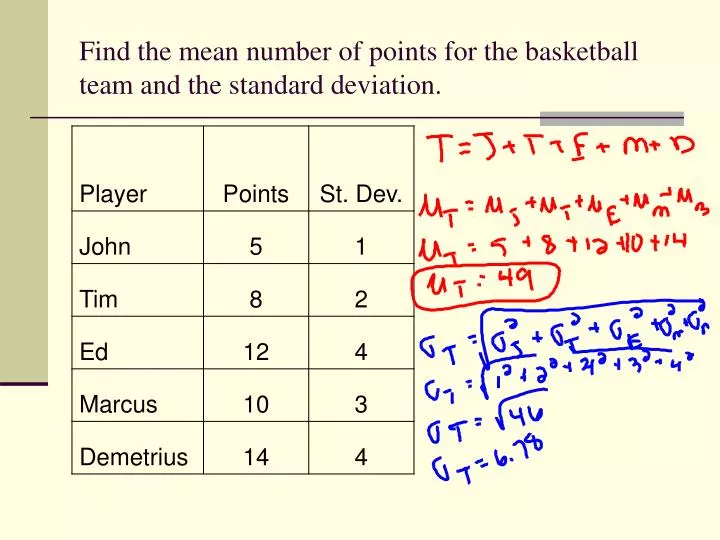
Find the mean number of points for the basketball team and the standard deviation.
Inference Test of Difference of Means Section 11.1
Experiment • Separate – boys & girls. • Take Pulse rates
Remember…. • Independent • Selection of one sample does not influence the selection of the other sample
So if we want to estimate the difference in means between two populations….. • The point estimate is: • So
The properties of the sampling distribution of • If n1 and n2 are sufficiently large or the populations normal, then the distribution will be approximately normal.
So what is the z-score for the difference in boys and girls pulse rates?
Remember: Use t test if σ is unknown • T-Test statistic Use boxplot to check for normal if samples are small & data given.
D.F. is a little more complicated! A conservative estimate of the P-value can be found by using a df = smaller of either n1-1 or n2-1.
Let’s try one! College financial aid offices expect students to use summer earnings to help pay for college. But how large are these earnings? One large university studied this by asking a random sample of 1296 students who had summer jobs how much they earned. They were then separated into two groups based on gender. Is there a difference in the amount males and females earn?
Amounts different for males & females? Parameter: = true mean amount males earned = true mean amount females earned
Hypothesis or Name Assumptions Use a 2 sample T test of means since σ is unknown • Random: samples chosen randomly • Approximately normal: n1>30 and n2>30. • Independent: more than 6750 males and 6210 females
Test Statistic Obtain a P-value P-value = tcdf (7.81, ∞., 620)*2 ≈ 0
Now to finish it up! Make a decision Reject the Ho since p-value(0) < α (0.05) State a conclusion There’s sufficient evidence to support the claim that there is a difference in the amounts earned by males and females.
Pooling the Data • If you prove the standard deviations are equal then you can pool the data together. • You don’t want to do this….it’s another type of hypothesis test to prove standard deviations equal • Never Pool!
If you bought a used camera in good condition from a friend, would you pay the same as you would if you bought the same item from a stranger.
Homework • Worksheet #1