Download
1 / 10
120 likes | 256 Views
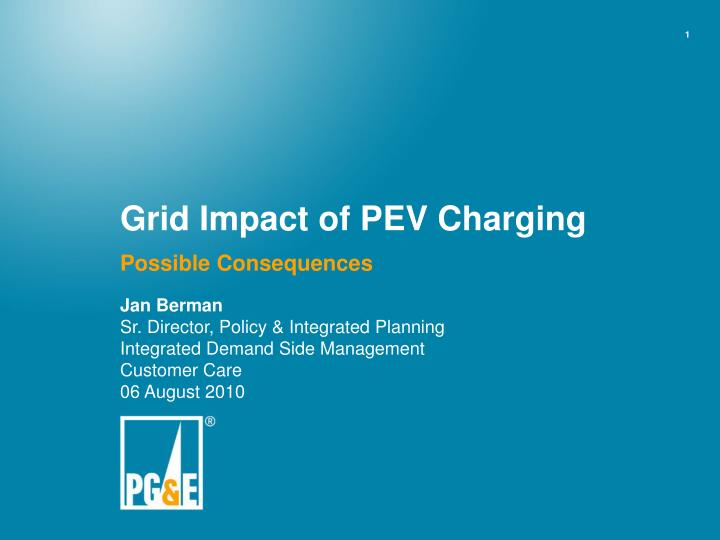
Grid Impact of PEV Charging. Possible Consequences. Jan Berman Sr. Director, Policy & Integrated Planning Integrated Demand Side Management Customer Care 06 August 2010. PEV Charging Creates a Significant Increase In Load. Customers will prefer a 240V charge to shorten recharge times.

E N D
Grid Impact of PEV Charging Possible Consequences Jan Berman Sr. Director, Policy & Integrated Planning Integrated Demand Side Management Customer Care 06 August 2010
PEV Charging Creates a Significant Increase In Load Customers will prefer a 240V charge to shorten recharge times PEV charging is a large load for PG&E customers, comparable to average peak summer load of a single home BEV Recharge time 16 hours 8 hours 4 hours 120V/12A 240V/15A 240V/30A Rate of charge
The Existing Grid Generation Customer Customer Transmission Substation Customer Customer Customer Customer Switching Device Customer
Scenario 1: Two PEVs in Berkeley, Two Circuits Generation Customer Customer Transmission Substation Customer Customer Customer Customer Switching Device Customer
Scenario 2: Two PEVs in Berkeley - Single Circuit Generation Customer Customer Transmission Substation Customer Customer Customer Customer Switching Device Customer
Zip code level Address level Specific Notification Drives Proper Upgrade Planning Generation Customer Customer Transmission Substation Customer Customer Customer Customer Switching Device Customer
Left Unmanaged, PEV Load Will Add to Peak Electric Demand 24 Hour Total Loading of Single Feeder - July 27, 2007 12000 11000 10000 9000 When most customers arrive home 8000 Total Loading at Substation (KW) off-peak load 7000 6000 Base Load Scenario (no PHEV) Case 1:- Do nothing (charge @6pm) 5000 Case 2:- TOU rates only (charge @9pm) Case 3:- TOU rates and Smart Charging (charge @9pm-1am) 4000 0 1 2 3 4 5 6 7 8 9 10 11 12 13 14 15 16 17 18 19 20 21 22 23 Hours Source: EPRI. Note: Feeder of Northeastern utility feeder during urban summer peak with 2,778 residential customers. PEV penetration = 10%. Case 1 – 3 charge @ 240V, 12A
Bay Area EV Adoption and Load Forecasts Correlate Cities with most hybrids per zip code PG&E EV Load Forecast Nissan Leaf Reservations 2007 Outage Density (# of outages per distribution transformer) * Hybrid registrations from 2004 to 2008, source: Polk & Co.
Thank You Contact: jsb1@pge.com