Download
1 / 16
170 likes | 342 Views
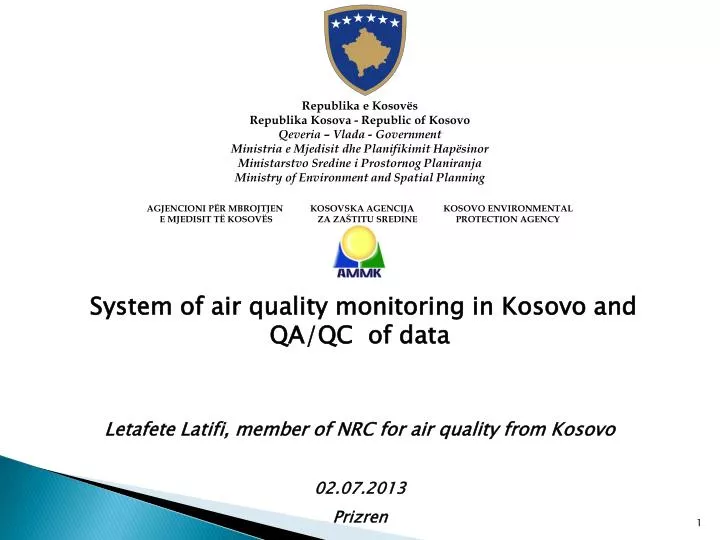
System of air quality monitoring in Kosovo and QA/QC of data Letafete Latifi, member of NRC for air quality from Kosovo 02 . 07 .201 3 Prizren. Monitoring network in Kosovo Monitoring equipment Softwares for collecting,processing and validation datas

E N D
System of air quality monitoring in Kosovo and QA/QC of data Letafete Latifi, member of NRC for air quality from Kosovo 02.07.2013 Prizren
Monitoring network in Kosovo • Monitoring equipment • Softwares for collecting,processing and validation datas • Softwares for checking functional parameters of equipments • QA/QC of air quality data
Air quality monitoring network in Kosovo Based on criteria for determination of monitoring location, according to directive 2008/50/EC,It’s decided that air quality monitoring network in Kosovo will have 12 fixed stations and 1 Mobile station. Locations and stations’ type are shown in map fig.1 and tab.1 Fig.1. map of air quality monitoing network
Air quality monitoring network in Kosovo Tab.1.description of network monitoring
Fixed stations for air quality monitoring Stations obtain: Analyzers of SO2,NOx(NO,NO2),CO,O3- -Teledyn API, seria E and T - Thermo scientifice, serie i and -Horiba Monitoring of PM10/PM25 -Thermo scientifice, Sharp Model 5030 -Grimm Model 180 and -Met one Instruments Sampler of PM10/PM25 and -Derenda -Tecora Sampler of BTX-Kalma secuencial sensors’ unit of meteorological parameters Fig.2 View from one of the fixed monitoring stations
Sample preparation lab • Sample preparation for determination of organic compounds: • 3 roto-evapuration and • Ekstra Fig3.Rota-evapuration • Sample prepartion for determination of heavy metals • Mikrovalmineralizues Fig.4.microwave for digestion
Analytical lab • Equipments for determination of inorganic compounds • ICP-MS,- for determination of heavy metals • IC – for determination of anions and cations Fig.5 ICP-MS (Couplied Plazmawith induction-mass spectrometria )and IC (Ion Cromatografy ) • Equipments for determination of organic compounds: • GC-MS- for determination of PH in air • GC-MS me DT- for determination of BTX in air GC-MS and GC-MS me DT
Calibration lab • Volumetric system – standard gas production • Concentrated gases sytem Calibration Volumetric system • Referent analyzers for SO2, CO, NOx (NO, NO2) and O3 . • Pump for generation of zero air SO2,CO, NOx, O3 analyzers
Process of data production Validation steps
Collecting, processing and validation data Data from different types of stations procesed and validated in diferent softwares, depending on analyzers’ producing factory,see pictures belowe. Software for equipments of Thermo scientifice Software for equipments of Teledyn API serie E Software for equipments of Teledyn API serie T
Statistical analyze and data validation • Collected and processed data from three different softwares are transferred in one software (application) which does data statistical analyzes. Software is designed by the assistance of Finish experts during implementation of Twining Project last year. (Application) where datas are transferred from all monitoring system
EMMA Software for collecting,processing, and validation data from AQ monitoring system • During this year a project which will install server for storing and collecting data from all stations has been implemented.In this server Software EMMA is configured .See fig,x belowe.
This software posseses one interface where the public will have access.Public can see the current data and export it.See fig.x belowe
QA/QC of air quality datas We have to trace the data every day, because equipment malfunction, human error, power failures and other disturbances can result incorrect data, these must be filtered out. Raw data is always kept unchanged, and reports of the edits made to the raw data are saved AQ data is corrected according to calibrations, this has to be done as soon as possible after the calibration. Continuous AQ data examination from hourly line chart, both daily data summaries and longer periods gives information about the slide of the zero level or the amplification of the analyser that will be noticed only from long time serie charts Continuous review of zero and span checks - inform field operators of any equipment malfunction or problem requiring attention
Can be incorrect values but need to be investigated reasons belowe before removal: • -Information from nearby industry, e.g. emission disturbance at the same time? • -Effects of meteorology (e.g. wind direction? ) • -Effect of power failure? • -Levels of other pollutants (e.g. O3 vs. NOx) • -Time of day/year • -Observations from other sites (visual comparison to AQ data from other measurement stations in the same figure) • Proper calibration of automatic monitors is essentialfor obtaining accurate AQ data. • For each calibration a correction factor (CF) and zero correction (ZC) is calculated. • Through this formula we calculate the corrected value: • Corrected value = CF(uncorrected value-ZC) • Both CF and ZC change linearly from “start” calibration • to “end” calibration .