Download
1 / 19
210 likes | 353 Views
Sensor Web Observing System Simulator (SWS) Project. High Fidelity Weather Modeling High Performance Computing Network of Observing Systems. September 9, 2008 Glenn J. Higgins (Northrop Grumman) Michael Seablom (NASA Goddard). Agenda. Overview and Background Architecture

E N D
Sensor Web Observing System Simulator (SWS) Project • High Fidelity Weather Modeling • High Performance Computing • Network of Observing Systems September 9, 2008 Glenn J. Higgins (Northrop Grumman) Michael Seablom (NASA Goddard)
Agenda • Overview and Background • Architecture • Example Use Cases • Limited Simulation Example • Plans
Overview • Sensor Web Observing System Simulator (SWS) is an ongoing NASA project contractually supported by Northrop Grumman (NG) • Outgrowth of NASA Earth Science Technology Office (ESTO)-funded activity leading to two major reports • Goal is to quantify impact of candidatechanges to weather forecast system on weather forecast accuracy • Support trade studies prior to investment, leading to cost savings • SWS creates test-bed for simulating future weather forecasting concepts, e.g., new sensors, targeted observing, etc. • Extension to climate monitoring observing systems desired • NRC decadal missions highest priority • Support Mission PI’s in defining mission requirements and impacts • Computationally intensive and large data sets
Genesis of SWS • ESTO Weather Architecture Studies (2002† & 2004‡) • Fundamental improvement in predictive skill may be obtained by incorporation of an additional feedback between the forecast model and the observing system • Existing technology can provide: • More frequent data collection in or near regions where the forecast model predicts development of a significant feature (e.g., GOES rapid scan mode) • New technology will be needed to enable, especially if resources limited: • Changing the observing mode of a satellite (power, slewing) • Dynamic asset deployment (e.g., UAVs) • Communication between the model and the sensor • Data collection in a more intelligent manner • Cloud-free lines of sight assessment • Higher density data collection in sensitive regions; lower density elsewhere • SWS project launched to provide simulation environment to test these ideas and ultimately facilitate trade studies Clausen, M., Kalb, M., McConaughy, G., Muller, R., Neeck, S., Seablom, M., Steiner, M., 2002: Advanced Weather Prediction Technologies: NASA’s Contribution to the Operational Agencies, ESTO Technical Report. Higgins, G., Kalb, M.,Lutz, R., Mahoney, R., Mauk, R., Seablom, M., Talabac, S., 2004: Advanced Weather Prediction Technologies: Two-Way Interactive Sensor Web & Modeling System, ESTO Technical Report.
SWS High Level Architecture Needs to accommodate current system and future concepts 1 2 3 4 6 5
Some Potential Use Cases: Quantifying Impact of Proposed Changes to Forecasting System on Forecast Accuracy UAV measurements to improve hurricane track/ intensity forecasts Doppler Lidar- 3D Winds Impact of different forecasts models XOVWM- sea surface winds Impact of new CONOPS (XOVWM: Extended Ocean Wind Vector Winds Mission)
SWS + EVEREST enable end-to-end sensor impact studies, including measurement accuracy-to-forecast accuracy Example of Integrating SWS and SensorModels NG EVEREST Core SWS Components Candidate Sensor Data Measurement Uncertainties Of Other Sensors • Simulated Weather Data • Real Weather Models • Simulated Weather Data for New Sensors • HPC Forecast Parameters Scenario Definition Measure -ment Simulation Data Assimilation Model GSI Forecast Model GEOS5 Each forecast cycle Truth Data (Nature Run) Performance Analysis Forecast Quality Performance Metrics EVEREST: Environmental Product VErification and Remote Sensing Testbed
Evolution of Weather Forecast Predictive Skill- a metric for comparing TIME SERIES of monthly mean anomaly correlations for 5-day forecasts of 500hPa heights for various operational models (CDAS frozen as of 1995) - Northern Hemisphere “Anomaly Correlation” An expression of how well predicted anomalies correspond to observed anomalies One metric of predictive skill of weather forecasts Improvements in predictive skill over the past several decades have been gradual; the sensor web provides an opportunity for a “revolutionary” impact Source: Fanglin Yang, Environmental Modeling Center, National Centers for Environmental Prediction, NOAA
Use Case: Decadal Survey Mission 3D Wind Lidar Global Wind Observing Sounder (GWOS) Life: 6 billion shots Source: Kakar, R., Neeck, S., Shaw, H., Gentry, B., Singh, U., Kavaya, M., Bajpayee, J., 2007: An Overview of an Advanced Earth Science Mission Concept Study for a Global Wind Observing Sounder.
Application of Sensor Web Concepts • Simulation: Extend Mission Life via Power Modulation • Conserve power / extend instrument life by using aft shots only when there is “significant” disagreement between model first guess line-of-sight winds and winds measured by fore shots • Lidar engineers have recently suggested reduced duty cycles may increase laser lifetimes • Duty cycles that are on the order of 10 minutes “on” and 80 minutes “off” may be very beneficial to mission lifetime • Some combination of space/ground processing would be required • Requires engineering trades be performed for on-board processing, storage, power, weight, communications
Simulation Results Lidar data deleted when there is “adequate” agreement with the numerical model’s first guess wind fields Designed to simulate suppression of the aft shot of the lidar Result: Nearly 30% of the lidar’s duty cycle may be reduced -- IF there is no discernible impact to forecast skill!
Simulation 1 Results Simulation Results (cont.) Anomaly Correlation versus Forecast hour Southern Hemisphere Northern Hemisphere Full lidar set and targeted lidar set are nearly identical -- indicating a reduced duty cycle may be possible Results in the Southern Hemisphere are more ambiguous; some indication of degradation due to targeting is evident Forecast Hour Forecast Hour Impact of duty cycle reduction on forecast skill, 20 day assimilation with 5-day forecasts launched at 00z each day. Results represent an aggregate over all forecasts
Computational Requirements for the simulation functionality demonstration • Computer System: NCCS (NASA Center for Computational Sciences) Palm System (SGI Altix) • Number of processors used: 64 CPUs • Global Model Resolution: 1x1 deg 72 levels • Wall Clock: 10 Simulation Days/ Day • Number of Days Processed: 20 days • Data Requirements: • Input: 10 GB/simulation day • Output: 10+ GB/simulation day • Note: Higher resolution simulations over longer times periods are planned requiring more computational resources
Status and Plans • Improve user interface, automate production, increase scope of simulation capability • Conduct new simulations • GOES-R (Geostationary Operational Environmental Satellite-R) • GWOS (Global Wind Observing Sounder) • XOVWM (Extended Ocean Wind Vector Winds Mission) • PATH (Precipitation and All-Weather Temperature and Humidity) Mission • Integrate NG Everest sensor modeling capabilities through collaboration with NGIT and NGST, brings • NPOESS (National Polar-orbiting Operational Environmental Satellite System) • Other sensors
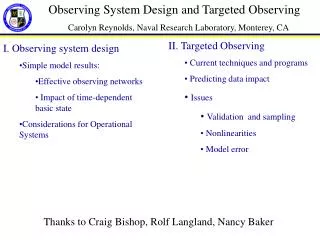
Data Assimilation Today “Survey Mode” Data Collection 2. Data analysis is performed 3. Numerical forecast is executed 1. Observations are collected at “routine” locations in space & time
Data Assimilation with Intelligent Sensor Webs Autonomous and On-Demand Targeting to Collect “Best” Observations 3. Numerical forecast is executed 4. Forecast error is estimated 2. Data analysis is performed 1. Observations are collected at specified locations in space & time Adaptive Targeting Automated / Manual Sensor Web Feedback Loop
Adapting SWS for other Decadal Missions • Decadal Missions have multiple purposes: • Climate research and monitoring • Health issues related to the environment • Ecosystem research and monitoring • Water resources monitoring • Weather prediction and research • The current SWS simulator design is aimed at modeling proposed changes to the forecast system and their impact on weather forecasting skill • It is not limited to changes in the observing system • The application of the SWS to other focus areas of the decadal missions, such as climate monitoring, requires additional use cases to further drive the design