Download
1 / 74
740 likes | 751 Views
Mid-Atlantic Food, Beverage and Lodging EXPO Baltimore, Maryland October 7, 2009. Thriving in the Mid-Atlantic Region: Challenging Times Create Innovative New Strategies. Paul Hartgen President Restaurant Association of Maryland. This program is sponsored by: AdvantEdge Services.

E N D
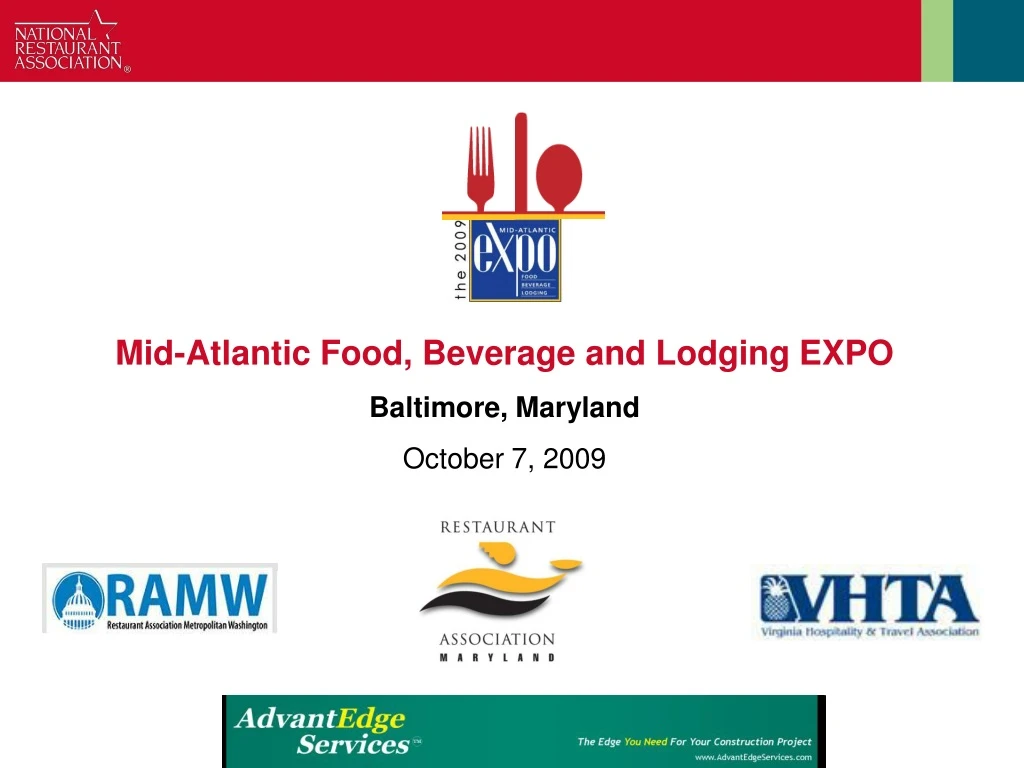
Mid-Atlantic Food, Beverage and Lodging EXPO Baltimore, Maryland October 7, 2009
Thriving in the Mid-Atlantic Region:Challenging Times Create Innovative New Strategies Paul Hartgen President Restaurant Association of Maryland
This program is sponsored by:AdvantEdge Services Herb Heiserman Principal, Heiserman Group Visit us at Booth #513
Restaurant Industry 2009 and Beyond Hudson Riehle Senior Vice President Research and Knowledge Group Mid-Atlantic Food, Beverage and Lodging EXPO Baltimore, Maryland October 7, 2009
Agenda Overview Economic Backdrop Industry Segments Industry Imperatives Jobs and Careers Food and Healthy Living Sustainability and Social Responsibility Profitability and Entrepreneurship Regional Outlook Wrap-Up
DEFINITION: “Restaurant Industry” Allmeals/snacks prepared away from home, including all takeout meals and beverages
Restaurant Industry Commercial Restaurant Services Non-Commercial Restaurant Services Military Restaurant Services
2008 + 2009 = Most Challenging Period for Restaurant Industry in Decades
39 Years of Restaurant-Industry Sales Source: National Restaurant Association
Annual Sales: $560+ billion
Employees: 13 million
Locations: 945,000
Restaurant Industry’s Share of the Food Dollar 1955: 25% Present: 48% Source: National Restaurant Association
Fullservice Quickservice Cafeterias and buffets Caterers Snack and nonalcoholic beverage bars Managed services/contractors at Industrial plants Hospital/nursing homes Schools and universities Airlines Recreation and sports centers Lodging places Retail hosts Book stores Service stations Convenience stores Self-operated restaurant services Military restaurant services The Industry Mosaic
National Economy Expected to Improve in 2010 U.S. Real Gross Domestic Product – Historical and Projected Growth Rates Source: Bureau of Economic Analysis; National Restaurant Association
4% 3.6% 3.2% 3.0% 3.0% 2.5% 2.2% 2.2% 2.1% 2.0% 2% 1.5% 1.2% 0% -0.7% -0.7% -2% -2.7% -4% -6% -5.4% Projected -6.4% -8% 07:Q1 07:Q2 07:Q3 07:Q4 08:Q1 08:Q2 08:Q3 08:Q4 09:Q1 09:Q2 09:Q3 09:Q4 10:Q1 10:Q2 10:Q3 10:Q4 Recovery Expected to Be Slow and Modest U.S. Real Gross Domestic Product – Quarterly Annualized Growth Rates Source: Bureau of Economic Analysis; National Restaurant Association
IncomeGrowth Expected to Remain Modest in 2010 Real Disposable Personal Income – Historical and Projected Growth Rates Source: Bureau of Economic Analysis; National Restaurant Association
Home Equity Cashed Out Through Refinancing Each Quarter Includes refinancing of prime, first-lien conventional mortgages Source: Freddie Mac
Personal Saving Rate Trending Upward Personal Saving as a Percentage of Disposable Personal Income Source: Bureau of Economic Analysis
Gas Prices Remain Below 2008 Levels Average price per gallon for regular gasoline Source: U.S. Department of Energy, Energy Information Administration
Tourism Drives Restaurant Sales Median proportion of restaurant sales represented by travelers and visitors 40% 25% 25% 15% Family Dining Casual Dining Fine Dining Quickservice Source: National Restaurant Association
International Arrivals to the U.S. Down 10% in First Half of 2009 Percent change in number of international arrivals to the U.S. Source: U.S. Department of Commerce; *Year-to-Date growth through June 2009
Job Losses Likely to Continue into 2010 Total U.S. Employment – Historical and Projected Growth Rates Source: Bureau of Labor Statistics; National Restaurant Association
Consumer Confidence Edging Back Up from Record Lows U.S. Consumer Confidence Index Source: The Conference Board
Wholesale Food Prices Down for First Time in Seven Years Wholesale Food Prices – Historical and Projected Growth Rates Source: Bureau of Labor Statistics; National Restaurant Association
Menu Prices Expected to Post Moderate Growth in 2009 Menu Prices – Historical and Projected Growth Rates Projected Source: Bureau of Labor Statistics; National Restaurant Association
SEPTEMBER 2007 Recruiting Employees34% Sales Volume 16 Food Costs 11 The Economy 9 Competition 7 Labor Costs 3 SEPTEMBER 2009 The Economy 34% Sales Volume 29 Labor Costs 6 Government 6 Recruiting Employees 5 Food Costs 3 SEPTEMBER 2008 The Economy 31% Food Costs 22 Sales Volume 15 Recruiting Employees 8 Gas/Energy Prices 6 Labor Costs 1 Economy Remains the Top Challenge Facing Operators Top Challenges Facing Restaurant Operators: Sep. 2007, Sep. 2008, Sep. 2009 Source: National Restaurant Association, Restaurant Industry Tracking Survey
Total Monthly Sales Just Slightly Above 2008 Levels Seasonally-adjusted Monthly Sales at Eating and Drinking Places (in billions) Source: U.S. Census Bureau
Values Above 100 = Expansion, Values Below 100 = Contraction Restaurant Performance Index Below 100 for 22nd Consecutive Month Source: National Restaurant Association
Values Above 100 = Expansion, Values Below 100 = Contraction Expectations Index Rising as Operators Grow More Optimistic Source: National Restaurant Association
Restaurant Operators Continue to Plan for Capital Expenditures Proportion of operators that made a capital expenditure for equipment, expansion or remodeling in last 3 months and plan to in the next 6 months Source: National Restaurant Association
-2.5%Real Decrease Fullservice Restaurant Sales $183 billion $181 billion 2008 2009 Source: National Restaurant Association
Pent-Up Demand for Restaurants Percent of adults NOT eating on-premises at restaurants as often as they would like Percentage 20072008Point Change All Adults 31% 33% +2 Household Income: $50,000 - $74,999 23% 29% +6 $75,000 or more 17% 24% +7 Source: National Restaurant Association
Percent of adults NOT eating on-premises at restaurants as often as they would like Pent-Up Demand for Restaurants Continues to Grow Source: National Restaurant Association
0.4%Real Increase Limited-Service Restaurant Sales $164 billion $157 billion 2008 2009 Source: National Restaurant Association
1.2%Real Increase Managed Services Sales $40.1 billion $38.3 billion 2008 2009 Source: National Restaurant Association
Over two out of five American adults have worked in the restaurant industry. Source: National Restaurant Association
Total Restaurant-Industry Employment 14.8 million 13.0 million 10.9 million 1999 2009* 2019* Source: Bureau of Labor Statistics; National Restaurant Association projections * Projected
Restaurants Down 119,500 Jobs from Pre-Recession Peak (-1.2%) Net Change in Eating and Drinking Place Employment (seasonally-adjusted) Source: Bureau of Labor Statistics
National Economy Down 7.2 Million Jobs (5.2% of Workforce) Net Change in Total U.S. Employment (seasonally-adjusted) Source: Bureau of Labor Statistics
Locally grown produce Bite size desserts Organic produce Nutritionally-balanced children’s dishes New/fabricated cuts of meat (e.g. Denver steak, pork flat iron, bone-in Tuscan veal chop) Hot/Trendy Food Offerings Fullservice Restaurants Source: National Restaurant Association; American Culinary Federation, 2008
Healthy options in kids meals Organic items Locally-sourced items Spicy items Wraps/pitas/tortillas Hot/Trendy Food Offerings Quickservice Restaurants Source: National Restaurant Association, Quickservice Restaurant Survey 2008
Micro-distilled/artisan liquor Culinary cocktails (e.g. savory, customized to specific dishes) Organic wine Craft beer/microbrews Specialty beer (e.g. seasonal, fruit) Hot/TrendyAlcoholic Beverage Offerings Fullservice Restaurants Source: National Restaurant Association; American Culinary Federation, 2008
Specialty iced tea (e.g. Thai-style, Southern/sweet, flavored) Organic coffee Flavored/enhanced water Green tea Espresso/specialty coffee Hot/Trendy Non-Alcoholic Beverage Offerings Fullservice Restaurants Source: National Restaurant Association; American Culinary Federation, 2008
Energy drinks Flavored/enhanced water Espresso/specialty coffees Sports drinks Iced tea Hot/TrendyNon-Alcoholic BeverageOfferings Quickservice Restaurants Source: National Restaurant Association, Quickservice Restaurant Survey 2008