Download
1 / 35
360 likes | 378 Views
Irrigation Efficiency Improvements: Technical, Economic,and Policy Issues. NM Geological Society NM Tech University, Socorro Frank A. Ward NMSU ACES April 12, 2013. History of Water Use in Rio Grande. Why that history is important Identify history/culture

E N D
Irrigation Efficiency Improvements: Technical, Economic,and Policy Issues NM Geological Society NM Tech University, Socorro Frank A. Ward NMSU ACES April 12, 2013
History of Water Use in Rio Grande • Why that history is important • Identify history/culture • Uncover long term water supply trends • Piece together lessons for current drought/climate adaptation • Data sources • Stream gauges since late 1800s (in and out of NM) • Historic tree ring analysis • Water delivery records of cities, towns, and other water suppliers (e.g., Santa Fe, Albuquerque, LC). • Historic farm land in production • Historical Documents (3 better-known) • Great River: The Rio Grande in NA History (P. Horgan, 1984) • Water in NM, A History of its Mgmt, Use (I. Clarke, 1987) • Historic Management of NM’s Acequias(Ackerly, 1996)
Acequias • A community-operated watercourse (canal, ditch, ditch system,…). • A publicly owned and operated irrigation facility. • In northern NM, the oldest were established before 1600.
History: some high points • 1598 – north of Rio Chama Rio Grande confluence: Onate build an acequia to irrigate crops (I Clark, 1987) • early 1600s – remarkably similar throughout the region (Torquemado, 1609) • 1700 - 1800, more than 100 acequia systems built (Dominguez). • 1752, Rio Grande below Albuquerque completely dry (Humbolt, 1966). • 1855-7, European immigrants learned hard lessons about the limits of crop growing without regular rainfall and streamflows (Davis, 1857). • Licenses for land worth little without water.
More High Points • 1891 (JW Powell) • Water control systems were limited by water, inefficient, and temporary • about 15000 acres irrigated in Taos Valley • Only about 1/3 of land under the ditch actually tilled (water limits land). • Also a problem in Afghanistan today.
Messages • Water supply limits (human) water use. • You can infer the history of water use in the Rio Grande if you can estimate long term supplies. • Before modern large storage dams, pumps, interbasin transfer projects, desalination technology, recycling and reuse, water in the river was the limiting resource
Reconstructed Flows, Tree Rings, Rio Grande at Otowi Gauge (1450-2002) Source, Treeflow: Woodhouse, Lukas, and Meko http://treeflow.info/riogr/riograndeotowinatural.html
Historic RG Flows into NM (k-af/yr)USGS Stream Gauge Data – 3 hws • Rio Grande at Del Norte (CO) • Flows = 657.93 – 109.17 post 2000 • 1891-2010 (110 years) • Conejos River at Mogote (CO) • Flows = 238.59 – 49.16 post 2000 • 1899-2010 (101 years) • Rio Chama at Chamita (NM) • Flows = 438.14 –99.05 post 2000 • 1970 – 2010 (41 years)
Background • Climate Change: more floods/droughts, greater conflict potential in dry places like NM • Continued population and urban demand growth • Shrinking key ecological assets • Irrigated ag consumes 85-90% of water in NM • Ongoing search for ways to conserve water in irrigated agriculture • technology (drip, sprinkler, water saving crops) • policy (subsidies, regulations, pricing, … ) • Projects (infrastructure, leveling, … )
Reducing irrigation water use • Reduce land in production • Cities buy or rent water or water rights from ag • Farm prices deteriorate • Alter crop mix, e.g.: • More acres in cotton • Fewer acres in alfalfa, pecan orchards • Develop more drought tolerant crop varieties • Reduce water application rates (deficit irrigate) • Shift to water conserving irrigation technology • To sprinklers • To drip irrigation
ReminderEvaporation v TranspirationIrrigation / AcWeighted Ave over Crops (EBID)
Separating E from TZ. Samani, NMSU, April 3, 2013 • No simple methods for separating E and T. His satellite ET map of EBID does not split E-T.
Gaps • Little work in NM (or elsewhere) explaining what affects irrigation water savings that integrates • Farm economics: profitability • Farm hydrology: water application • Agronomy: yields by crop • Basin hydrology: net water depletions • Basin institutions: protect senior water rights
Aims • Data: Assemble data on crop water applications, crop water use, yields, land in production, crop mix, cost, and prices that characterize economics of irrigated ag in NM’s RG Project Area • Economic analysis: Analyze profitability, production, land and water use in the Area. • Policy Analysis: Forecast the same for: • Several drip irrigation subsidies 2 • Selected water supply scenarios 6
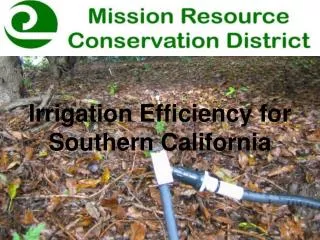
Study Region: Elephant Butte Irrigation District • http://www.ebid-nm.org/
Approach • Analyze water conservation subsidies that reduces capital cost to convert from surface to drip. • Farm Income effect • Hydrologic effect on water app/depletion • Integrates farm economics and basin hydrology
Farm Economics • NMSU Farm costs and returns • Published by NM county, year, crop, and irrigation technology • Web -- http://aces.nmsu.edu/cropcosts/
Farm Water Economics 101 • Compare drip and surface irrigation • Drip: better applies quantity and timing of water that the plant needs for max yields • Drip: higher yields higher ET, lower aquifer recharge • Drip: reduces water applied • Drip: conversion costs are high
Cost of Converting:Surface to Drip Irrigation • Conversion Capital Costs: • About $2500 / ac for 10 year life • About $365 / ac per year at 7% interest • Conversion is a major investment, so for the conversion to increase income: • Yield gain must be high • or • $ Value of saved water must be high
EBID Remote Sensing: NMSU • Basin-wide Evapotranspiration mapping • Demand forecasting, water operations support • Depletion changes with: • Management options • Changing crops • Drought cycles • Informs sustainable water management
Quantitative Analysis of NM Ag Water Conservation • Maximizes Farm Income by choosing land in production, by • crop • irrigation technology • Subject to Constraints • Hydrologic (gw, sw) • Agronomic: yields, including salinity • Economic: Pecan acreage • Institutional
Constraints • EBID land: about 90 K acres • EBID area water price and supply • SW = 4 – 6” 2013 • GW = $90 per af pumped 2013 • Salinity impacts on yields • Institutional • Endangered Species Act • Rio Grande Compact • US Mexico Treaty of 1906 • Rio Grande Project operation agreement (NM/TX) • Water Rights Protection • No increase in water depletions: NM OSE
Lessons Learned: water- conserving technology • Irrigators invest in water-saving technologies when faced with lower costs for converting from surface to drip. • Drip irrigation subsidies farm income, crop yields, value of food production, and crop water applications. • By raising crop yields and raising crop water ET, drip irrigation subsidies put upward pressure on water depletions. • Where water rights exist, authorities need to guard against depletions with growing subsidies that reduce water applications. • In RG Project Area, NM, the economic value of water is $126 - $128 per acre foot depleted with 20% of full surface supplies (e.g. 2013).
Research Questions • What policies would sustain NM’s aquifers affordably? • What actions would reduce ag water use likely to occur? • Without climate change • With climate change that affects: • Yields • Evaporation • ET • Supplies • With high, medium, low future: • Prices • Yields • Costs
Tentative answers • Better water measurement • Gauges • Tracking use by crop (application, ET) • Better water accounting • Current use patterns • Potential use patterns • Adjudications • Who has the senior/junior rights in the face of future supply variability. Important as drought/climate intensifies. • Can promote trading water for $
Thank you http://agecon.nmsu.edu/fward/water