Download
1 / 63
630 likes | 639 Views
An Introduction to the IRI Data Library. Michael Bell. Objectives. Become familiar with the organization of the Data Library Learn how to find datasets and select spatial and temporal domains See how to perform simple arithmetic analyses See how to create customized maps and graphs

E N D
An Introduction to the IRI Data Library Michael Bell
Objectives • Become familiar with the organization of the Data Library • Learn how to find datasets and select spatial and temporal domains • See how to perform simple arithmetic analyses • See how to create customized maps and graphs • Learn how to download data and images • Understand how the Data Library is related to the IRI Map Room
Structure of Course • Introduction to the organization and primary tools of the Data Library • Group examples • Individual examples
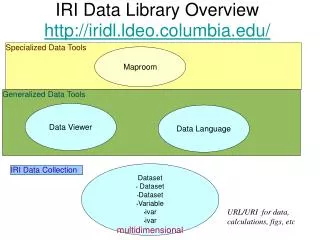
The IRI Data Library is a… • Data repository • >300 datasets covering all aspects of climate-related characteristics • Data analysis tool • Arithmetic operations EOF analysis • Data visualization tool • Time series, maps, cross-sections • Data download resource • Free access to text, binary, GIS-compatible, etc. data files http://iridl.ldeo.columbia.edu
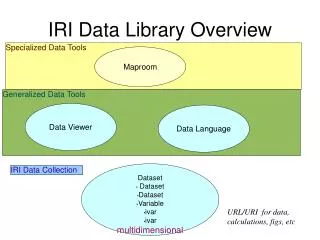
Structure of Datasets -Primary Organization -Dataset -Dataset -Variables -Dataset -Variables -Dataset -Variables -Primary Organization . . . . -NASA -ERBE (Earth Radiation Budget Experiment) -Datasets by instrument -Variables -GES-DAAC (Distributed Active Archive Center) - -GISS -LeGrande_Schmidt2006 (authors) -GPCP (Global Precip Climatology Project) -Datasets by version -Datasets by instrument -Variables . . . . Example
Data Browse/Search Map Room Search
Function Bar -Access to data manipulation, visualization, download tools
Documentation Access Points Source Bar -Navigational information -Where am I? What operations have I performed? -Documentation access
Dataset and Variables -Access to variables or lower-level datasets
Grids (Independent Variables) -Information about grids on which data is dependent -Latitude (Y) -Longitude (X) -Time (T) -Others (height/depth, ensemble member, etc.)
Note new information -Selected variable shown in Source Bar -Datasets and variables heading gone -More information about variable below
Important information about variable -Missing value indicator -Units
Function Bar -Access to data manipulation, visualization, download tools View Links -Access data viewer
Data Selection -Data domain selection
Filters -Common data manipulation tools
- Monthly Climatology/Anomaly • Average over any ind. variable • Root mean square • Find max/min values over any ind. variable
Data Files -Access to data downloads
Tables -Access to tabular data for Excel, etc.
Expert mode -Manually enter Ingrid code
Data Selection -Data domain selection
Data Selection Step 1. Change text in Setting Ranges boxes using same syntax as text already there. Step 2. Click Restrict Ranges button. Step 3. When satisfied information in top box represents desired domain, click the Stop Selecting button.
Example Time (T) 1 Oct 1996 to 31 Jan 1997 Latitude (Y) 60S to 60N Note: Center of nearest grid point automatically selected.
Note: New data domain now represented in Source Bar and grid information.
Redraw Zoom To Full Help
Change Time -Change text and redraw -Select button with adjacent date Make Animation -Enter range of dates (date1 “to” date2) and redraw
Change Region -Click and drag box over area -Change lat/lon limits and redraw
Change Color Scale Limits -Enter new limits and redraw
Change Map Options -Use pull down menus to: -Change axis selection -Draw admin boundaries -Draw contours, etc. -Use Edit plot button to add more customizations
Change Map Options -Select a new color scale -Add admin boundaries Return to Viewer -Click more options
Download map -Select desired format for map and color scale
Return to dataset page -To maintain domain selections from viewer, click data in view button. -To return without saving selections, click Entire Dataset link or dataset link at top of page.
Download Data File Step 1. Select Data Files link. Step 2. Select link for desired format.