Download
1 / 17
170 likes | 412 Views
Advances in statistical methods for (gene) set enrichment analysis . Roland Nilsson May 25 th , 2010. Why gene set enrichment analysis. Find trends in data that correlate with ”functional groups” of genes Aggregation over gene sets reduces multiplicity and can increase power.

E N D
Advances in statistical methods for(gene) set enrichment analysis Roland NilssonMay 25th, 2010
Why gene set enrichment analysis • Find trends in data that correlate with ”functional groups” of genes • Aggregation over gene sets reduces multiplicity and can increase power Mootha et al., Nat Genet 34:267–273 (2003)
Overview of enrichment analysis Predefined gene sets Modified from: Subramanian et al.PNAS 102:15545--1550 (2005)
Other examples • Promoter motifs • Compound screening Gene induction 3-days After PGC-1a overexpression Mootha et al., PNAS 101:6570–6575 (2004) Relative cell growth on glucose vs. galactose Gohil et al., Nat Biotech 28:249–255 (2010)
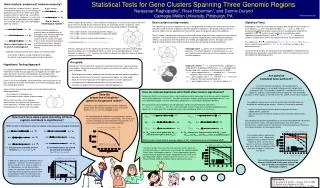
Two very different questions • Q1: are there genes in set S that correlate with the phenotype? • Q2: are the genes in set Smore strongly correlated with the phenotype than a random set of genes of the same size? • Q2 does not imply Q1 ! • Q1 is addressed by permuting samples • Q2 is addressed by re-sampling genes • This requires independence of gene statistics under H0 • Sometimes only Q2 is testable Independent Dependent Bin counts Bin counts Gene set P-values Gene set P-values
Choice of gene-level statistic • Base statistic: fold-change, z-score, pearson correlation, etc. • Keep positive/negative values separate?
Cutoff methods • Simple cutoff / step function cutoff at K genes x genes from S above cutoff N genes total M genes in gene set S • Null hypothesis: ranks of genes in S are random sample from {1 ... N }→ classic urn model: X ~ hypergeometric(N, K, M) • How do we find the parameter K? • Set K based on gene-level significance • Discards information, conservative Beißbarth & Speed, Bioinformatics 20:1464–1465 (2010)
Rank-based methods • Aggregation of ranks rg Compound measure F(rg ) tg • Mann-Whitney U statistic (rank sum) • GSEA (modified one-sided Kolmogorov-Smirnov) • These statistics are designed based on Q2 Barry et al, Bioinformatics 21:1943–1949 (2005) Subramanian et al., PNAS 102:15545--1550 (2005) Mootha et al., Nat Genet 34:267–273 (2003)
Aggregation of gene statistics • Sums, medians, Efron’s max-mean, etc. rg Compound measure F(tg ) tg • Typically based on independent gene statistics assumption • Power depends strongly on |S| • Difficult to compare statistics between data sets Pavlidis et al., Pac Symb Biocomp 2002, 474–485 Tian et al., PNAS 102:13544–13549 (2005) Efron and Tibshirani, Ann Appl Stat 1:107–129 (2007)
False discovery rate control • For each gene set S, compute permutation p-value FDR correction(e.g. Benjamini-Hochberg) x M gene sets • Pooling permuted statistics Tail ratio FDR Efron and Tibshirani, Ann Appl Stat 1:107–129 (2007)
Comparative studies Table 3 • Efron & Tibshirani 2007 • Advocates the max-min statistic • Does not consider the ”competitive” Q2 hypothesis • Ackermann & Strimmer 2009 • Advocates rank sum statistics; GSEA statistic exhibits low power • focus on gene re-sampling • Simulations did not include correlated p-values under the null Efron and Tibshirani Ann Appl Stat 1:107–129 (2007) Ackermann & Strimmer, BMC Bioinformatics 10:47 (2009) Song & Black, BMC Bioinformatics 9:502 (2008)
What’s driving the enrichment? • Re-test individual genes within a significant gene set S • Selection bias problems ”Leading edge”
What gene sets to test? • Publicly available databases, e.g. mSigDB • Often several highly overlapping gene sets unnecessary multiplicity • Gene set curation is not perfect ...
Structured testing • Testing on the GeneOntology subset graph • Find the most specific gene sets for which the null can be rejected • Only applies to Q1 testing • Controls FWER Goeman & Mansmann, Bioinformatics 24:537–544 (2008)
Beyond gene sets ... • Might be more appropriate to encode prior information as a network (graph) • ”Network enrichment” statistic:find gene set S that maximizes a score • NP-hard, but exact solution is possibleusing integer linear programming • Significance assessment usually bygene permutations (Q2 !) Ideker et al., Bioinformatics 18:S223–S240 (2002) Dittrich et al., Bioinformatics 24:i223–i231 (2008)
Further analysis of enrichment results Ben-Porath et al., Nat Genet 40:449–507 (2002)
Some (subjective) recommendations • Rank-based methods have good power, generally applicable • Simple aggregation measures work well, e.g. rank sum • But the K parameter problem seems unavoidable • Use sample permutations for significance testing if possible • Can be combined with ”competitive” (Q2) statistics (rank sum) • Pooled gene set statistics are hard to interpret