Download
1 / 25
250 likes | 400 Views
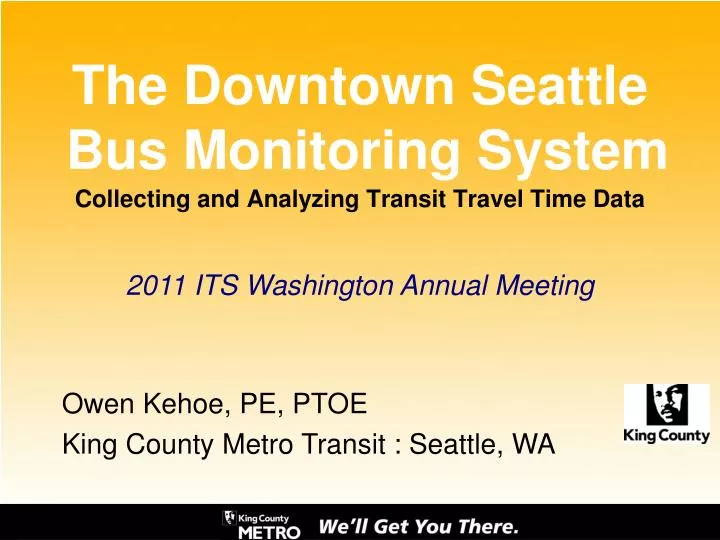
The Downtown Seattle Bus Monitoring System. Collecting and Analyzing Transit Travel Time Data. 2011 ITS Washington Annual Meeting. Owen Kehoe, PE, PTOE King County Metro Transit : Seattle, WA. Bus Monitoring?. Project Background Data Sources: AVL, APC & AVI Data Processing & Reporting

E N D
The Downtown Seattle Bus Monitoring System Collecting and Analyzing Transit Travel Time Data 2011 ITS Washington Annual Meeting Owen Kehoe, PE, PTOE King County Metro Transit : Seattle, WA
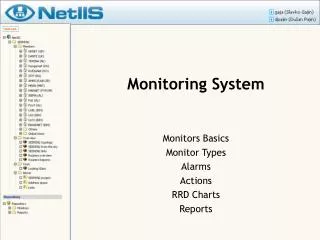
Bus Monitoring? • Project Background • Data Sources: AVL, APC & AVI • Data Processing & Reporting • System in Action • Lessons Learned
Seattle Bus Monitoring System Background
History • Enhanced Travel Time Monitoring Need • 2005-2007: Bus Tunnel Closure • 2009-2016: Alaskan Way Viaduct • Uses • Scheduling/Funding • Identifying Problem Areas • Planning for the Next Impact
Current Focus AWV • Alaskan Way Viaduct • Long-term detours • Reduced capacity • Enhanced Transit Services Agreement • WSDOT provides funding for transit • Added trips • Schedule Maintenance • Expand Monitoring System Source: WSDOT
Seattle Bus Monitoring System Data sources
AVL System • AVL = Automatic Vehicle Location • Signpost/Odometer based system • Travel time between timepoints only! • Route specific • Off-route buses not tracked • Data available System-Wide AVL Data feeds OneBusAway
APC System • APC= Automated Passenger Counter • Sampling Method • 20% of Fleet APC-Equipped • Data Available After Service Change • Other Data Collected • Travel Time between Bus Stops • Dwell Time APC Data used to Track Ridership Trends
AVI System • AVI = Automatic Vehicle Identification • Roadside RFID tag readers • Legacy TSP tags • Tags logged regardless of Route/Schedule • Strategic Locations AVI Reader TSP Tag
AVI Reader Locations • Original AVI System • North CBD Screenline • Central CBD Screenline • South CBD Screenline Outer CBD Screenline • Expanded AVI System • Outer CBD Screenline • W Seattle Screenline • Other Key Locations Other Key Locations
AVI Reader Communication Readers communicate using Spread-Spectrum Wireless Phone drops provide backhaul to KC server Outer CBD Screenline Each reader has unique Node # Other Key Locations
Seattle Bus Monitoring System DATA PROCESSING & REPORTING
Huge amount of data! • MS Access and SQL Server • Make AVL data more useful • Interpolate timepoint data into street segments • GIS and Bus Stop data Estimate travel time share Travel Time = 5 min AVL Data GIS Data Length= 1000’ Speed= 20 mph Length= 2000’ Speed= 30 mph Length= 1000’ Speed= 25 mph A B C D Bus Stop Data Dwell = 30 sec Dwell = 20 sec Share 0.41 0.29 0.30 2.0 min 1.5 min 1.5 min Travel Time = 3 min
Matching • Need to combine AVL & AVI Data • AVI CBD and selected locations • AVL Outlying points • Travel Times calculated by matching • Coach ID, Route, Run, Date, [Time] Start Point End Point Coach: 2345 Route/Run: 5/13 Date: 3/14/2010 Timestamp: 10:34:33 Coach: 2345 Route/Run: 5/13 Date: 3/14/2010 Timestamp: 10:42:56 Match! Travel Time=8:23
Types of Reports • Regular Reporting • Specific Pathways • Defined by roadway infrastructure • Grouped by Market Coverage Area • 3x/Year Service Change • Ad-hoc Reporting • Special cases • As needed basis
Pathway Report Two Directions, Two Charts Pathway Map Sample Size: Indication of Data Quality Scenario Info
Pathway MOE’s • Slice data into hour intervals • Median Travel Times (Average) • 25th – 75th Percentile (Reliability) Compare scenarios side-by-side 25th & 75th Percentile { Median Travel Time One Bar represents one hour of data
Seattle Bus Monitoring System System in Action
Monitoring tells a Story 12-13 minute delay PM peak Mid-Day Train Blockages • Baseline Condition: Fall 2009 • Fall 2010: 1st & Spokane Ramp Closure • Lengthy & unreliable detour • Spring 2011: Lane Reduction on SR-99 • Routes moved to 3rd Ave • Traffic diversion to 1st Ave
Ad-Hoc Reporting Alaskan Way Viaduct 8-Day Closure Results
Experiments in Real-Time Real-Time Travel Time Tool
Seattle Bus Monitoring System Lessons Learned
AVI Equipment Challenges Power Connections RF Interference Tag Reads 900MHz Band Fixed Frequency Wireless Communication 900MHz Spread Spectrum Repeaters Read Rate Reliability
Data Processing Challenges Return Trips Confound Matching No Trip ID in AVI data Use maximum travel time cap Same Endpoints, Different Pathway Filter with Schedule Data Development Effort Expanded territory added complexity Ongoing refinement
The Downtown Seattle Bus Monitoring System Collecting and Analyzing Transit Travel Time Data Owen Kehoe, PE, PTOE owen.kehoe@kingcounty.gov King County Metro Transit Seattle, WA