Download
1 / 30
300 likes | 431 Views
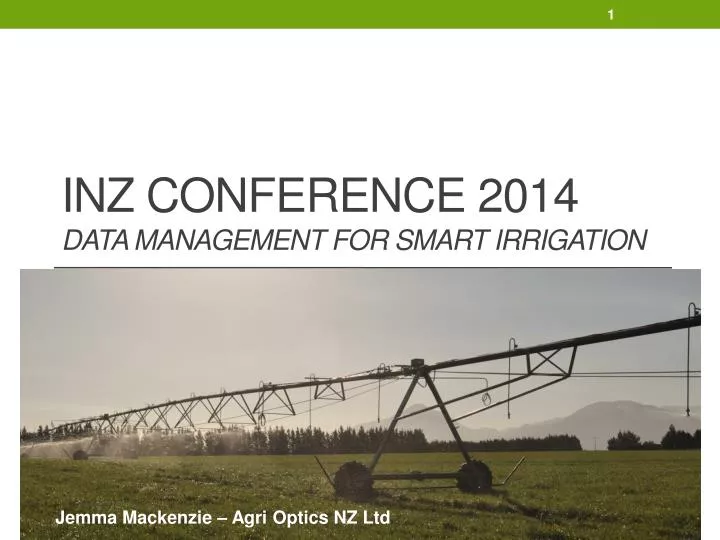
INZ Conference 2014 Data management for Smart Irrigation. Jemma Mackenzie – Agri Optics NZ Ltd. SMART Irrigation. It’s about taking what we do currently and doing it SMARTER Putting the RIGHT INPUT in the RIGHT PLACE at the RIGHT TIME in the RIGHT AMOUNT and in the RIGHT MANNER

E N D
INZ Conference 2014Data management for Smart Irrigation Jemma Mackenzie – Agri Optics NZ Ltd
SMART Irrigation • It’s about taking what we do currently and doing it SMARTER • Putting the RIGHT INPUT in the RIGHT PLACE at the RIGHT TIME in the RIGHT AMOUNT and in the RIGHT MANNER • Utilising technology to achieve more ‘precise’ irrigation practices
What’s in the toolkit? • GPS – Trimble, John Deere, Topcon, Leica, Raven etc. • EM Surveying – EM38 & DualEM • Topographic Surveying – DEM, Slope, Aspect, Landscape Change etc • Variable Rate Irrigation – Precision Irrigation, PGGW/IQ, Valley, Reinkeetc • Data Management – tying all the info together • Yield Maps – all new combines equipped, often cheap upgrade!
It’s all about building up the base data picture of what’s happening on your farm
Data Sources Topography features EM Surveying Weather Stations Soil Moisture Probes
What is EM Surveying? • A very important layer! • A map to quantify differences in ‘soil type’ across an area • Used to create irrigation zones • Can get accurate topography data at the same time • No physical contact with the soil • Measures up to 0-75cm and 0-150cm simultaneously EM 0-60cm
What is EM Surveying? EM38 – How it Works. • EM38 generates a constant magnetic field that penetrates into the soil profile. • Measures the bulk electrical conductivity of the soil profile. • Responds to changes in relative amounts of: • Clay. • Salts (Electrolytes). • Rock. • Water. • No physical contact with the soil. • Vertical mode to 1.5m, Horizontal mode to 0.75m.
What do you get from an EM Survey? • A full report on differences in soil variability and topography features • A better understanding of your soils and property • Areas identified for closer monitoring and potential VRI zones EM 0-60cm EM 0-135cm Elevation Landscape Change Slope Aspect
EM Mapping for Irrigation Management • Neutron probes placed in different soil zones to enable fine tuning of management • More than 100mm of WHC variation so need different management
EM Mapping for Irrigation Management cont. • Sites 1, 4 and 5 had highest yields in 2012 • Anticipated that sites 2 and 3 would have highest yield due to heaviest soils • Over-watering occurred causing a yield penalty in zones 2 & 3 • Loss of yield 3.71t/ha or $593/ha when averaged across the whole field • VARIABLE RATE IRRIGATION HAS BEEN APPLIED IN 2012 TO ELIMINATE THIS PROBLEM!! • 2012/13 & 2013/14 yields were considerably less variable & overwatering eliminated
Soil Moisture Data • Any data better than none • Helps make future management decision not only this season but for infrastructure development ahead • Place probes in known soil types • Ideally more than one per farm or even one per crop • Use soil moisture data to inform not only irrigation scheduling but also other inputs such as fert timing etc
Weather Data & On-Farm Measurement Lysimeter - ECan Eddy Co-variance Tower - NIWA
Data Management Tying it all together, increasing efficiency, giving accountability and traceability in an ever changing environment.
Data Rich Farming • All kinds of data available on farm today • Helps make decisions • Can start to use map nutrient & water input on a spatial level for potential future use in models • Or more educated paddock or farm averages • Starts to fine tune your management decisions and put $$$ around what your doing • The more data the more control you have in your business!
Summary • There is a wide range of data available for smarter irrigating today – don’t wait! • Using the core data elements – soil type, topography, soil moisture, weather - will fine tune your irrigation mangement & increase your long term business vaibility and environmental sustainability • Utilising ‘Smart Irrigation’ techniques is the way to move New Zealand’s agriculture industry forward progressively into the 21st century