Download
1 / 21
220 likes | 328 Views
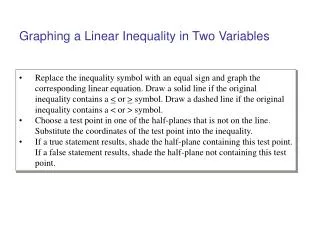
Graphing Linear Equations in Two Variables. Mr. Wilson Honors Algebra 1-2, FWJH September 28, 2012. What is a Graph?. A graph is a list of ordered pairs following the coordinates on the axes. We usually call the horizontal axis the x-axis The vertical axis is usually called the y-axis

E N D
Graphing Linear Equations in Two Variables Mr. Wilson Honors Algebra 1-2, FWJH September 28, 2012
What is a Graph? • A graph is a list of ordered pairs following the coordinates on the axes. • We usually call the horizontal axis the x-axis • The vertical axis is usually called the y-axis • We write these ordered pairs as (x,y) • We start where the axes intersect: the origin • A graph can have a finite or an infinite number of ordered pairs.
A Graph with Finite Points • We can individually list all the points
A Graph with Infinite Points • We can draw lines or curves without lifting our pencils
Graphing Equations • The points we draw are solutions to a specific equation or meet certain requirements • Linear Equations (what we’ll be doing today!!) • Quadratic Equations (Later this year) • Learn more kinds of equations in Algebra 3-4, trig, and different classes.
Example of Graphing Equations • Find all points (x, y) that satisfy
What Equations Can Describe This? • I Image courtesy of wolframalpha.com
What Does a Linear Graph Look Like? Things to pay attention to: The shapes of the graphs The looks of the equations
Crickets: Nature’s Weatherman • Counting the number of times a cricket chirps in 7 seconds can tell you the temperature!
Skiing Down a Mountain • A Skier’s elevation (E) as she skis down a mountainside over time (t) is
How Many Mullahys? • The number of Ms Mullahys is
Taxi Fares • What will the taxi fare (F) be for a trip covering a distance of M miles?
What Are Some Things We Noticed? 1) Graph is a straight line. 2) Have an infinite # of ordered pair solutions. 3) Variables do not have exponents. no x2 or y3 business 4) Can have either one or two variables. From now on, we’ll just use x and y as our variables.
Are These Linear Equations? 1) y = 2x - 4 2) 3x + 6y = 9 3) x2 + y2 = 15 4) x = -3 5) 2y/3 – x = 12
Question Determine whether (x,y) = (3, 4) a solution of y = 2x – 2 Is (3,4) on the graph of y = 2x – 2
Determine whether (5, -1) is on the graph of y = 2x + 7
How To Graph a Linear Equation • Step 1: Solve for y by itself. • Step 2: Make a two-column t-chart. We’ll put x on the left and y on the right. • Step 3: Pick a few different values of x (your choice, but pick ones that will be easy to work with.) • Step 4: For each x you picked, determine what value yhas to be. • Step 5: Plot your ordered pairs
How to Graph a Linear Equation • Step 6: Draw a straight line through your points. Make the line go on forever. (Note: the graph MUST go through ALL your points) • Example: y = 2x - 2
SLATES TIME • Graph the equation y = 3x -4 • Graph the equation 3y – 3x = 6