Download
1 / 37
370 likes | 467 Views
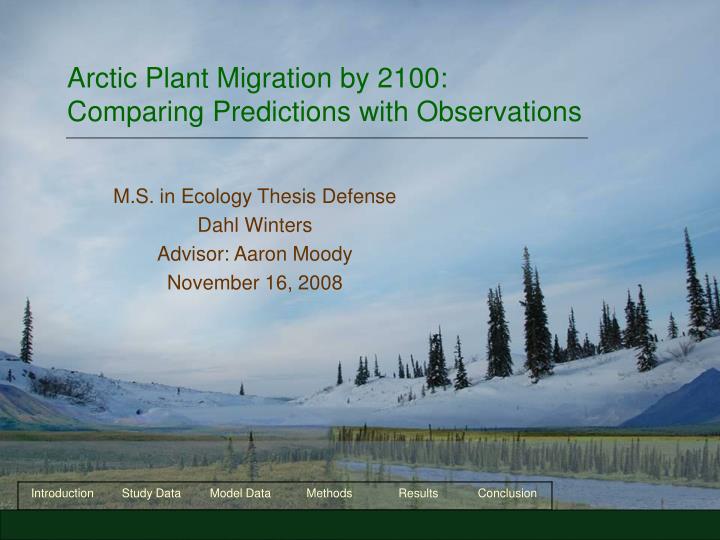
Arctic Plant Migration by 2100: Comparing Predictions with Observations. M.S. in Ecology Thesis Defense Dahl Winters Advisor: Aaron Moody November 16, 2008. Introduction – importance of Arctic plant migration, the Arctic Climate Impact Assessment, and the goals of this research

E N D
Arctic Plant Migration by 2100:Comparing Predictions with Observations M.S. in Ecology Thesis Defense Dahl Winters Advisor: Aaron Moody November 16, 2008
Introduction – importance of Arctic plant migration, the Arctic Climate Impact Assessment, and the goals of this research • Study and Model Data – examples of recent Arctic vegetation changes, and predictions of future change • Methods – how the study data will be used to validate a key Arctic vegetation model • Results – maps of study findings, model validation, and assessment of errors • Conclusion – wrapping up Presentation Overview
Why the Arctic Region and its Vegetation Matter • Arctic defined as the region above 55°N latitude • Floristically simple, but 30-35% of terrestrial carbon is stored in its boreal forests, primarily in the soil • Region warming the fastest due to climate change – average of 0.6-1.0°C this century • Warming there can accelerate warming everywhere due to - albedo feedback of forest invasion (more heat absorption) and- increased soil microbial activity (more CO2 release) Introduction
Plant Migration and Arctic Vegetation Change • Not unique to the present; extended periods of Eocene volcanism allowed forests to grow across much of today’s Arctic tundra regions. • Of concern is the present rate of CO2 input – faster than anyon record. Temperature expected to increase 1.5-6°C by 2100. • Plants are expected to shift their ranges northward and upward in response to warmer temperatures. • Potential for great impacts on both carbon storage and climate change. Introduction
Important Questions • How well do we understand Arctic plant migration? • Can major Arctic research groups produce a model of future vegetation distributions that accurately reflects recent trends of change? • How accurate might such a model be, and what might be some limitationson its accuracy? Introduction
The Arctic Climate Impact Assessment (ACIA) • a 1024-page document produced in 2004 by two groups: • Arctic Council- a high-level intergovernmental forum (Canada, Denmark, Finland, Iceland, Norway, the Russian Federation, Sweden, and the US) • International Arctic Science Committee (IASC) - a non-governmental organization that facilitates cooperation in all research aspects throughout the Arctic. • Project Goal - to evaluate and synthesize knowledge on climate variability, climate change, increased ultraviolet radiation, and their consequences. • http://www.acia.uaf.edu/pages/scientific.html Introduction
Research Objective • One component of ACIA was to predict vegetation distributions by 2100. They used 2 dynamic vegetation models, LPJ and BIOME4. • Objective is to validate one of the two ACIA models using actual observations from the Arctic region. • Chose BIOME4 by Kaplan et al. (2003) over LPJ due to finer resolution of biome types. Research Objective
Find study observations • Determine what change trends they indicate • + if they show vegetation change expected due to warming temperatures, - if opposite, 0 if no change or not observed. • A necessary assumption is that the trend will continue into 2100. • Determine what the model predicts • Compare present-day with predicted vegetation to determine what biome transitions are predicted. • Assess data-model matches • Map matches • Discuss sources of error The Model Validation Process
Finding Observations for Model Validation • Restricted search to: • articles reporting plant migration or other climate-driven vegetation changes in the Arctic region (> 55°N latitude) • studies where significant grazing was not noted, to focus only on climate-induced vegetation changes. • Found 35 studies within the Arctic; an additional 15 studies were found below 55°N latitude. Study Data
Examples: Masek (2001) • little support for latitudinal migration, but coarse spatial resolution. Study Data
Examples:Sturm et al. (2001) • this and other aerial photograph studies provide greater spatial resolution over longer time scales. Aerial photographs of the Ayiyak River in the Alaskan Arctic (N68°53’ W152°31’) showing an increase in shrub patch density, individual shrub growth, and shrub expansion into previously shrub-free areas. A and B denote the same locations in the two photographs. From Sturm et al. (2001). Study Data
Common Threads Among Study Observations • Dominant tree and shrub species are experiencing increases in growth and new establishment throughout the Arctic. • Spatial and temporal resolution makes a difference • Migration <- water availability + connectivity + landscape • Periods of peak establishment <- water availability • Growth reductions <- drought stress or local cooling • Support for the plant migration process Study Data
The Process of Plant Migration • Warming temperatures induce increased plant growth. • If site conditions are favorable, stand densities will increase over time. • If conditions are favorable beyond a species’ current range, new establishment will occur there = altitudinal or latitudinal migration. • If conditions fail to remain favorable,growth and establishment will haltand dieback may occur. Study Data
Tree Growth Increases Stand Density Increases Migration Tundra Treeline Space (alt or lat gradient) Open Forest Limit Closed Forest Limit Time • The Process of Plant Migration Study Data
Present-day vegetation Predicted 2100 vegetation • BIOME4 Model Data for Validation • Present-day and 2100 prediction maps from Kaplan et al. (2003) • Both maps at 0.5° resolution Model Data
GIS Framework for Precise Data-Model Comparison • model prediction map georeferenced • study data imported when geocoordinates available • polygons digitized – introduces error • allows for easy comparison of model predictions and study observations. • Only 30 of the 35 studies • had sufficient information to be representedin GIS. • however, yielded 94 total study sitessuitable for model validation. Methods
Scoring Study Sites for Change Trends • All study sites were scored in each of 4 categories: alt/lat migration, tree growth, and stand density/abundance. • Each category was assigned a +1 for change expected due to warming temperatures, -1 if change is opposite that of expected, and 0 if no change or not observed. • Nested data structure: 12 of the 30 studies had multiple findings for multiple study sites; othershad single findings for one or more study sites. Methods
Measurement Uncertainties of Study Sites • Of the 94 sites, all could be mapped as points except for 15 requiring polygons. • Points with geocoordinates provided had no introduced error; polygons had up to 0.5 degree error due to vertex estimation. • Since the BIOME4 model output is limited by its climate model to 0.5-degree resolution, polygon error is expected to be a problem near biome boundaries and areas of hightopographic relief. Methods
Comparing Study Trends with Model Predictions • Entered all study points and polygons into GIS • For each site, the sign of the reported change (+1 if expected from warming temperatures) was recorded in the shapefile attribute table. • Also recorded was the sign of the predicted change from BIOME4, determined by comparing the model output map to the present-day vegetation map. • Agreement: determined by assessingwhether the data and model matched. Methods
Study locationson present-day vegetationmap • yellow = points • red boundaries = polygons Results
Study locationson modelprediction mapfor 2100 • yellow = points • red boundaries = polygons Results
Altitudinal Migration • green = treeline recession • yellow = none observed • red = treeline advance Results
Latitudinal or Horizontal Migration • green = treeline recession • yellow = none observed • red = new establishment Results
Tree Growth • form change • height growth • radial growth • canopy cover • green = growth reduction or dieback • yellow = none observed • red = increased growth or increased stem initiation Results
Stand Density and Abundance • green = dieback or loss of individuals • yellow = none observed • red = infilling of new individuals in existing stands (no extension of the range limit) Results
Overall Change • green = negative trend; transition to a cooler biome expected • yellow = zero trend • red = positive trend; transition to a warmer biome expected Results
Model Predictions • green = transition to a cooler biome predicted • yellow = no transition • red = transition to a warmer biome expected Results
Validation Results by Study Site • BIOME4 was validated at 68 of the 94 total study sites (72.3%), and invalidated at 27 sites (28.7%). • yellow = no validation • red = validation Results
Validation Results over All Sites • Binary match variable (1 = match, 0 = no match) • Study sites are nested within their respective studies • A generalized linear mixed effects model: • accounts for the nested data structure • will give a probability that all study sites will validate the model (not all sites will validate it) • provides a measure of how well BIOME4has performed for all 30 studies. Results
Mixed Effects Model Results • m1<-lmer(Match~1+(1|Study), dat, family="binomial") • Estimate Std. Error z value Pr(>|z|) • (Intercept) 1.0306 0.2875 3.585 0.000337 *** • p = e^1.0306 / (1+e^1.0306) • Confidence intervals using +/- standard error before solving for p: p = 0.737(+0.0519 and -0.0593). Results
94 study sites 68/94 (72.3%) validated model 26/94 (27.7%) invalidated model 43/68 (63.2%) >1 biome type within 0.5°) 11/68 (16.2%) polygons (0.5° error) 23/26 (88.5%) >1 biome type within 0.5°) 4/26 (15.4%) polygons (0.5° error) • Summary of Validation Results • Over All Sites: 73.7% (+5.19%/-5.93%) Mean Number of Biome Types within 0.5° Sites that invalidated the model had a higher mean number of biome types. Results
Resolution – A Potential Cause of Mismatches • Numbers indicate # of biome types within 0.5° of each study site for both the present-day and 2100 prediction maps. • Biome boundaries • Topographically complex areas Results
Recap: Sites Where the Model Was Validated • yellow = no validation • red = validation Results
Research Objective Met • Objective was to validate a model used in ACIA, to test our understanding of Arctic plant migration. • Was able to map where the model was validated, though more than 30 points would have improved the validation. • Errors from geolocating study sites and scoring them for changes – each study done differently, measuring different species. Conclusion
Tree Growth Increases Stand Density Increases Migration Tundra Treeline Space(alt or lat gradient) Open Forest Limit Closed Forest Limit Time • Other Possible Reasons for Mismatches • Warming-induced drought stress not accounted for • Time lags - reasons for migration not being fast enough • Site constraints • Topographic constraints • Life history characteristics • Dispersal constraints Conclusion
Directions for Further Research • Improving models of future Arctic vegetation • natural and anthropogenic disturbances (insects, forest fragmentation – future Arctic resource development) • effects of acid rain, air pollution, and past grazing - migrationcould be faster without these. • Understanding the broader impacts of plant migration on • Arctic carbon storage • global climate change Conclusion
Questions? • Dahl Winters • UNC Ecology • wintersd@email.unc.edu Conclusion