Download
1 / 18
180 likes | 263 Views
WHY HIGH-QUALITY POPULATION SIZE ESTIMATES OF KEY POPULATIONS ARE IMPORTANT. David Wilson HNP - GP World Bank. ‘We Have Run Out Of Money; Now We Have to Think’ W.S. Churchill. Joint Program Competencies as Pillars of Strategic Planning.

E N D
WHY HIGH-QUALITY POPULATION SIZEESTIMATES OF KEY POPULATIONS AREIMPORTANT David Wilson HNP - GP World Bank
‘We Have Run Out Of Money; Now We Have to Think’ W.S. Churchill
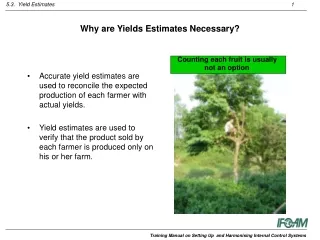
What Does Success Look Like?India Joint Program Example Understand the epidemic Design: Implementation efficiency 70% of transmission sex work in 4 states Deliver: Effectiveness Sustain: Sustainability Understand: Allocative Efficiency
What we know • Inaction is costly, and not the equivalent of nothing happening; It is hard to reverse epidemic once established • Whereas harm reduction is • Effective - in terms of HIV cases averted • Cost-effective - in terms of healthy years gained and costs • Social benefits exceed treatment costs • And benefits the whole population
What is the global coverage of harm reduction services? An estimated 10% access NSP An estimated 8% access OST About 14% of HIV+ PWID access ART • Few PWID access all three priority interventions • Female PWID far lower access than males • Source: Authors’ literature review and estimates, using Mathers et al. 2010
How much is spent on harm reduction? • Estimated $160 million in LMIC in 2007(3 cents per PWID per day): 90% from international donors • Global Fund largest HR funder (estimated $430 million 2002-2009) >50% to Eastern Europe and Central Asia • Sources: Stimson et al 2010 (three cents report), UNAIDS 2009; UNAIDS Progress report 2012; Global State of Harm Reduction, 2012; Bridge et al 2012
How much is needed to scale up priority harm reduction interventions? • Very preliminary resource estimates based on regional estimates of current NSP /OST /ART coverage, population sizes and unit costs • Mid and high target scenarios costed
Summary: Estimated annual cost of scale-up of NSP, OST and ART for PWIDs • 1: Mathers et al, Lancet (2010) 2: Scale-up calculations by UNSW
Annual scale-up costs by region and intervention • Costs dominated by Eastern Europe and Central Asia • 1: Mathers et al, Lancet (2010) 2: Scale-up calculations by UNSW
Cost-effectiveness and relative return on investment ranges by region() number of studies in literature • CE1: • ROI2: • CE1: • ROI2: • CE1: • ROI2: • CE1: • $402-$34,278(9) • $1.1-$5.5(3) • $97-$564(3) • $1.4(1) • $1,456-$2,952(1) • $71-$2,800(7) • $1.2-$8.0(4) • Western Europe, North America & Australasia • Eastern Europe & Central Asia • The Middle East & North Africa • South, East & South East Asia • Latin America & The Caribbean • Sub-Saharan Africa • 1: Cost per HIV infection averted 2: Total future return per $1 invested (3% discount rate)
Harm Reduction Data Challenges • Limited population size estimates • Inconsistent service quality data • Surveys miss hidden populations • ATS increasingly used and injected but missed in surveys • Significant but undocumented scale-down of services • Sources: UNGASS country progress reports 2012; Mathers et al., 2010; Global State of Harm Reduction, 2012
Why we need reliable estimates of the size of populations at high risk • Policy • Advocacy • Response planning and resource allocation • Estimates number of infected with HIV and projections of the burden disease • Programming • Intervention planning • Measurement of coverage • M & E interventions
Define Population Size and Program Targets Population Size Estimation with Modeling to Improve Estimates Adjust for SW mobilitywithmathematical model to reduce double-counting of SW frequenting multiple spots Regressionmodellingto generate province-wide SW population size estimatesfrom the townsmapped, withlower and upperbounds and