Download
1 / 29
290 likes | 522 Views
Testing Hypotheses and The Standard Error. Testing Hypotheses and The Standard Error.

E N D
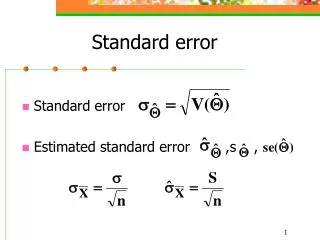
Testing Hypotheses and The Standard Error • The standard error, as an estimate of chance fluctuation, is the measure against which the outcomes of experiments are checked. Is there a difference a “real” difference or merely a consequence of the many relatively small differences that could have arisen by chance? • To answer this question, the standard error of the differences between means is calculated and the obtained difference is compared to this stand error.
Examples: Differences Between Means and Absolute and Relative Differences • Two problems: one of absolute and relative size of differences and one of practical or “real” significance versus statistical significance. • The difference of 0.164 is probably trivial even though statistically significant. The 0.164 was derived from a 7-point scale of smoking frequency, and is thus really small.
Examples: Differences Between Means and Absolute and Relative Differences • One should ordinarily not be enthusiastic about mean differences like 0.2, 0.15, 0.05, and so on, but one has to be intelligient about it.
Correlation Coefficients • How low is low? At what point is a correlation coefficient too low to warrant treating it seriously? • The problem is complex. In basic research, low correlations—of course, they should be statistically significant—may enrich theory and research. It is in applied research where prediction is important. It is here where value judgments about low correlation and the trivial amounts of variance shared have grown. In basic research, however, the picture is more complicated. One conclusion is fairly sure: correlation coefficients, like other statistics, must be tested for statistical significance.
Hypothesis Testing: Substantive and Null Hypotheses • The main research purpose of inferential statistics is to test research hypotheses by testing statistical hypotheses. • Broadly speaking, scientists use two types of hypotheses: substantive and statistical. A substantive hypothesis is the usual type of hypothesis discussed in Chapter 2, where a conjectural statement of the relation between two or more variables is expressed.
Hypothesis Testing: Substantive and Null Hypotheses • Statistical hypotheses must be tested against something, however. It is not possible to simply test a stand-alone statistical hypothesis. That is, we do not directly test the statistical proposition in and of itself. We test it against an alternative proposition. Naturally, there can be several alternatives to . The alternative usually selected is the null hypothesis, which is invented by Sir Ronald Fisher.
Hypothesis Testing: Substantive and Null Hypotheses • The null hypothesis is a statistical proposition that states, essentially, that there is no relation between the variables. The null hypothesis says, “You’re wrong, there is no relation; disprove me if you can.”
Hypothesis Testing: Substantive and Null Hypotheses • Researchers sometimes unwittingly use null hypotheses as substantive hypotheses. The trouble with this is that it places the investigator in a difficult position logically because it is extremely difficult to demonstrate the empirical “validity” of a null hypothesis. After all, if the hypothesis is supposed, it could well be one of the many chance results that are possible, rather than a meaningful nondifference!
Hypothesis Testing: Substantive and Null Hypotheses • Fisher (1950) says, “Every experiment may be said to exist only in order to give the facts a chance of disproving the null hypothesis.”
Hypothesis Testing: Substantive and Null Hypotheses • Although as researchers we want to demonstrate that is true, it cannot be done in a direct way easily. If we want to test this hypothesis directly, we would need to test an infinite number of values. That is, we would need to test each and every situation where is not equal to zero.
Hypothesis Testing: Substantive and Null Hypotheses • In hypothesis testing, the procedure dictates that we test the null hypothesis. The null hypothesis is written as . Note that it points directly to a value, namely zero. What we need is to gather enough empirical data to show that the null hypothesis is not tenable.
Hypothesis Testing: Substantive and Null Hypotheses • In statistical terms, we would “reject H0” Rejecting H0 would indicate to us that we have a significant result. Rejecting H0 leads us to ward supporting H1. Supporting H1, in turn leads to support for our substantive hypothesis.
Hypothesis Testing: Substantive and Null Hypotheses • If there are not enough empirical data to refute the null hypothesis, we would not be able to reject the null hypothesis. Statistically we would say “failed to reject H0” or “do not “reject” H0; one can never “accept” H0. To “accept” H0 would require repeating the study an infinite number of times, and getting exactly zero each time. On the other hand, we can “fail to reject” H0 because the results are not sufficiently different from what one would predict (under the assumption that H0 is true) to warrant the conclusion that it is false.
Hypothesis Testing: Substantive and Null Hypotheses • The states of H0 is akin to the defendant in a trial who is deemed to be “innocent” until proved “guilty.” If the trial results in a verdict of “not guilty”, this does not mean the defendant is “innocent.” It merely means that guilt could not be demonstrated beyond a reasonable doubt. • When the investigator fails to reject H0 it does not mean H0 is true, merely that H0 cannot be shown to be false beyond a “reasonable” doubt.
The General Nature of a Standard Error • If there was no random error, there would be no need for statistical tests of significance. Any difference at all would be a “real” difference. But alas, such is never the case. • There are always chance errors (and biased errors, too), and standard errors are measures of this error. The standard error is the standard deviation of the sampling distribution of any given measure.
The General Nature of a Standard Error • Suppose we draw a random sample of 100 children from eighth-grade classes in such-and-such a school system, and we find the mean=110 and SD=10. How accurate is this mean? • What we do is to set up a hypothetical distribution of sample means, all calculated from samples of 100 pupils, each drawn from the parent population of eighth-grade pupils. If we know the mean of this population of means, everything would be simple. In fact, we cannot obtain it. The best we can do is to estimate it with our sample value, or sample mean. We simply say, in this case, “Let the sample mean equal the mean of the population mean” —and hope we are right. Then we must test our equation. We do this with the standard error.
The General Nature of a Standard Error • The formula for the standard error of the mean: • This is also called the sampling error. • Just as the standard deviation is a measure of the dispersion of the original scores, the standard error of the mean is a measure of the dispersion of the distribution of sample means.
A Monte Carlo Demonstration • Table 12.1, 12.2 • The procedure • Generalizations • The Central Limit Theorem • The Standard Error of the Differences Between Means
The Central Limit Theorem • If samples are drawn from a population at random, the means of the samples will tend to be normally distributed. The larger the Ns, the more this is so. And the shape and kind of distribution of the original population makes no difference. • Why is it important to show that distributions of means approximate normality? We work with means a great deal in data analysis, and if they are normally distributed then one can use the known properties of the normal curve to interpret obtaained research data.
Statistical Inference • To infer is to derive a conclusion from premises or from evidence. To infer statistically is to derive probabilistic conclusions from probabilistic premises. We conclude probabilistically; that is, at a specified level of significance. • Another form of inference, discussed at length in the chapter on sampling, is that from a sample to a population.
Statistical Inference • One of the gravest dangers of research is the inferential leap from sample data to population fact. • It can be said, in sum, that statistics enable scientists to test substantive hypotheses indirectly by enabling them to test statistical hypotheses directly. They test the “truth” of substantive hypotheses by subjecting null hypotheses to statistical tests on the bases of probabilistic reasoning.
Testing Hypotheses and the Two Types of Errors • Figure 12.3, type one and type two errors • H0 is rejected with the awareness that an error might have been made, but the chances of that happening are less than 0.05. The conclusion of rejecting H0 on an average is correct more than 95% of the time. • As a rule, in selecting a significance level one must decide which type of error is more important to avoid or minimize. To be certain that an event of some importance has been identified before reporting it, use a fairly stringent criterion of significance, such as 0.01. On the other hand, if there is greater concern not to miss something, use a less stringent level, such as 0.05.
Testing Hypotheses and the Two Types of Errors • Table 12.3. • The size of the sample is related to both types of errors. With a fixed value of type one error and a fixed sample size n, the value of type two error is predetermined. If type two error is too large, it can be reduced by either raising the level of type one error for fixed n, or by increasing n for a fixed level of type one error. Although type two error is seldom determined in an experiment, researchers can be assured that it is reasonably small by collecting a large sample.
The Five Steps of Hypothesis Testing • Using our substantive hypothesis we can state it statistically. Even though we have referred to it as our statistical hypothesis, many statisticians refer to it as the research, or experimental or alternative hypothesis. • Table 12.4.
Sample Size Determination • A sample that is too large is a waste of resources. A sample that is too small is also a wasted effort since it will not be large enough to detect a significant effect (difference). • By increasing the sample size, the sampling distribution becomes narrower and the standard error becomes smaller. As a result, a large sample increases the likelihood of detecting a difference. However, too large of a sample will make a very small difference statistically significant, but not necessarily of practical significance.
Sample Size Determination • The formula to estimate sample size for each group for a simple random sample is • If sampling is from a finite population of size N, and the sampling is done without replacement,
Sample Size Determination • Researchers who want to protect themselves on both type one error and type two error can use the following formula for each group,
Sample Size Determination • The procedure described above is for a one-tailed test. For a two-tailed test, only the will change.