Download
1 / 52
520 likes | 664 Views
Elements of Nonlinear Statistics and Neural Networks. Vladimir Krasnopolsky NCEP/NOAA (SAIC). Outline. Introduction: Motivation Classical Statistic Framework: Regression Analysis Regression Models (Linear & Nonlinear) NN Tutorial Some Atmospheric & Oceanic Applications

E N D
Elements of Nonlinear Statistics and Neural Networks Vladimir Krasnopolsky NCEP/NOAA (SAIC) V.Krasnopolsky, "Nonlinear Statistics and NNs"
Outline • Introduction: Motivation • Classical Statistic Framework: Regression Analysis • Regression Models (Linear & Nonlinear) • NN Tutorial • Some Atmospheric & Oceanic Applications • Accelerating Calculations of Model Physics in Numerical Models • How to Apply NNs • Conclusions V.Krasnopolsky, "Nonlinear Statistics and NNs"
Problems for Classical Paradigm: Nonlinearity & Complexity High Dimensionality - Curse of Dimensionality New Paradigm under Construction: Is still quite fragmentary Has many different names and gurus NNs are one of the tools developed inside this paradigm Motivations for This Seminar Complex, nonlinear, multi-disciplinary, high-dimensional systems Simple, linear or quasi-linear, single disciplinary, low-dimensional systems Objects Studied: 1900 – 1949 1950 – 1999 2000 – … T (years) Complex, nonlinear, high-dimensional framework… (NNs) Under Construction! Simple, linear or quasi-linear, low-dimensional framework of classical statistics (Fischer, about 1930) Tools Used: Studied at the University! Materials presented here reflect personal opinions and experience of the author! V.Krasnopolsky, "Nonlinear Statistics and NNs"
Statistical Inference:A Generic Problem Problem: Information exists in the form of sets of values of several relatedvariables (sample or training set) – a part of the population: {(x1, x2, ..., xn)p, zp}p=1,2,...,N • x1, x2, ..., xn- independent variables (accurate), • z- response variable (may contain observation errors ε) We want to find responsesz’q for another set of independent variables {(x’1, x’2, ..., x’n)q}q=1,..,M V.Krasnopolsky, "Nonlinear Statistics and NNs"
Regression Analysis (1):General Solution and Its Limitations Sir Ronald A. Fisher ~ 1930 REGRESSION FUNCTION z = f(X), for all X INDUCTION Ill-posed problem DEDUCTION Well-posed problem DATA: Training Set {(x1, x2, ..., xn)p, zp}p=1,2,...,N DATA: Another Set (x’1, x’2, ..., x’n)q=1,2,...,M zq = f(Xq) TRANSDUCTION SVM Find mathematical function f which describes this relationship: • Identify the unknown functionf • Imitate or emulate the unknown functionf V.Krasnopolsky, "Nonlinear Statistics and NNs"
Regression Analysis (2):Identification vs. Imitation IMITATION IDENTIFICATION V.Krasnopolsky, "Nonlinear Statistics and NNs"
Regression Analysis (2):A Generic Solution • The effect of independent variables on the response is expressed mathematically be the regression or response function f: y = f( x1, x2, ..., xn; a1, a2, ..., aq) • y - dependent variable • a1, a2, ..., aq - regression parameters (unknown!) • f - the form is usually assumed to be known • Regression model for observed response variable: z = y + ε = f(x1, x2, ..., xn; a1, a2, ..., aq) + ε • ε - error in observed value z V.Krasnopolsky, "Nonlinear Statistics and NNs"
Regression Models (1):Maximum Likelihood • Fischer suggested to determine unknown regression parameters {ai}i=1,..,q maximizing the functional: here ρ(ε) is the probability density function of errors εi • In a case when ρ(ε) is a normal distribution the maximum likelihood => least squares Not always!!! V.Krasnopolsky, "Nonlinear Statistics and NNs"
Regression Models (2):Method of Least Squares • To find unknown regression parameters{ai}i=1,2,...,q, the method of least squares can be applied: • E(a1,...,aq) - error function = the sum of squared deviations. • To estimate {ai}i=1,2,...,q=> minimizeE => solve the system of equations: • Linear and nonlinear cases. V.Krasnopolsky, "Nonlinear Statistics and NNs"
Regression Models (3):Examples of Linear Regressions • Simple Linear Regression: z = a0 + a1 x1 +ε • Multiple Linear Regression: z = a0 + a1 x1 + a2 x2 + ... + ε= • Generalized Linear Regression: z = a0 + a1 f1(x1)+ a2 f2(x2) + ... + ε = • Polynomial regression, fi(x) = xi, z = a0 + a1 x+ a2 x2 + a3 x3 + ... +ε • Trigonometric regression, fi(x) = cos(ix) z = a0 + a1 cos(x) + a1 cos(2 x) + ... + ε No free parameters V.Krasnopolsky, "Nonlinear Statistics and NNs"
Regression Models (4):Examples of Nonlinear Regressions • Response Transformation Regression: G(z) = a0 + a1 x1 + ε • Example: z = exp(a0 + a1 x1) G(z) = ln(z) = a0 + a1 x1 • Projection-Pursuit Regression: • Example: V.Krasnopolsky, "Nonlinear Statistics and NNs"
NN Tutorial:Introduction to Artificial NNs • NNs as Continuous Input/Output Mappings • Continuous Mappings: definition and some examples • NN Building Blocks: neurons, activation functions, layers • Some Important Theorems • NN Training • Major Advantages of NNs • Some Problems of Nonlinear Approaches V.Krasnopolsky, "Nonlinear Statistics and NNs"
MappingGeneralization of Function • Mapping: A rule of correspondence established between vectors in vector spaces and that associates each vector X of a vector space with a vector Y in another vector space . V.Krasnopolsky, "Nonlinear Statistics and NNs"
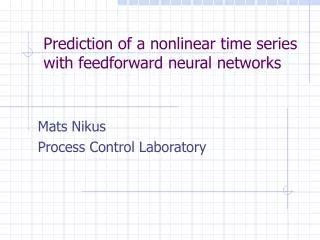
Mapping Y = F(X): examples • Time series prediction: X = {xt, xt-1, xt-2, ..., xt-n}, - Lag vector Y = {xt+1, xt+2, ..., xt+m} - Prediction vector (Weigend & Gershenfeld, “Time series prediction”, 1994) • Calculation of precipitation climatology: X ={Cloud parameters, Atmospheric parameters} Y = {Precipitation climatology} (Kondragunta & Gruber, 1998) • Retrieving surface wind speed over the ocean from satellite data (SSM/I): X = {SSM/I brightness temperatures} Y = {W, V, L, SST} (Krasnopolsky, et al., 1999; operational since 1998) • Calculation of long wave atmospheric radiation: X = {Temperature, moisture, O3, CO2, cloud parameters profiles, surface fluxes, etc.} Y = {Heating rates profile, radiation fluxes} (Krasnopolsky et al., 2005) V.Krasnopolsky, "Nonlinear Statistics and NNs"
Neuron NN - Continuous Input to Output Mapping x1 x2 tj Linear Part aj · X + bj = sj Nonlinear Part (sj) = tj x3 xn Multilayer Perceptron: Feed Forward, Fully Connected Output Layer Hidden Layer Input Layer Y = FNN(X) Jacobian ! V.Krasnopolsky, "Nonlinear Statistics and NNs"
Some Popular Activation Functions X X X X V.Krasnopolsky, "Nonlinear Statistics and NNs"
NN as a Universal Tool for Approximation of Continuous & Almost Continuous MappingsSome Basic Theorems: • Any function or mappingZ = F (X), continuous on a compact subset, can be approximately represented by a p (p 3) layer NN in the sense of uniform convergence (e.g., Chen & Chen, 1995; Blum and Li, 1991, Hornik, 1991; Funahashi, 1989, etc.) • The error bounds for the uniform approximation on compact sets (Attali & Pagès, 1997): ||Z -Y|| = ||F (X) - FNN (X)|| ~ C/k k -number of neurons in the hidden layer C – does not depend on n (avoiding Curse of Dimensionality!) V.Krasnopolsky, "Nonlinear Statistics and NNs"
NN training (1) • For the mapping Z = F (X) create a training set - set of matchups {Xi, Zi}i=1,...,N, where Xi is input vector and Zi - desired output vector • Introduce an error or cost functionE: E(a,b) = ||Z - Y|| = , where Y = FNN(X) is neural network • Minimize the cost function: min{E(a,b)} and find optimal weights (a0, b0) • Notation: W = {a, b} - all weights. V.Krasnopolsky, "Nonlinear Statistics and NNs"
NN Training (2) One Training Iteration E ≤ W V.Krasnopolsky, "Nonlinear Statistics and NNs"
Backpropagation (BP) Training Algorithm • BP is a simplified steepest descent: where W - any weight, E - error function, η - learning rate, and ΔW - weight increment • Derivative can be calculated analytically: • Weight adjustment after r-th iteration: Wr+1 = Wr + ΔW • BP training algorithm is robust but slow V.Krasnopolsky, "Nonlinear Statistics and NNs"
Generic Neural NetworkFORTRAN Code: NN Output Jacobian V.Krasnopolsky, "Nonlinear Statistics and NNs"
Major Advantages of NNs : • NNs are very generic, accurate and convenient mathematical (statistical) models which are able to emulate numerical model components, which are complicated nonlinear input/output relationships (continuous or almost continuous mappings ). • NNs avoid Curse of Dimensionality • NNs are robust with respect to random noise and fault- tolerant. • NNs are analytically differentiable (training, error and sensitivity analyses): almost free Jacobian! • NNs emulations are accurate and fast but NO FREE LUNCH! • Training is complicated and time consuming nonlinear optimization task; however, training should be done only once for a particular application! • Possibility of online adjustment • NNs are well-suited for parallel and vector processing V.Krasnopolsky, "Nonlinear Statistics and NNs"
NNs & Nonlinear Regressions:Limitations (1) • Flexibility and Interpolation: • Overfitting, Extrapolation: V.Krasnopolsky, "Nonlinear Statistics and NNs"
NNs & Nonlinear Regressions:Limitations (2) • Consistency of estimators: α is a consistent estimator of parameter A, if α→A as the size of the samplen→N, where N is the size of the population. • For NNs and Nonlinear Regressionsconsistency can be usually “proven” only numerically. • Additional independent data sets are required for test (demonstrating consistency of estimates). V.Krasnopolsky, "Nonlinear Statistics and NNs"
ARTIFICIAL NEURAL NETWORKS:BRIEF HISTORY • 1943 - McCulloch and Pitts introduced a model of the neuron • 1962 - Rosenblat introduced the one layer "perceptrons", the model neurons, connected up in a simple fashion. • 1969 - Minsky and Papert published the book which practically “closed the field” V.Krasnopolsky, "Nonlinear Statistics and NNs"
ARTIFICIAL NEURAL NETWORKS:BRIEF HISTORY • 1986 - Rumelhart and McClelland proposed the "multilayer perceptron" (MLP) and showed that it is a perfect application for parallel distributed processing. • From the end of the 80's there has been explosive growth in applying NNs to various problems in different fields of science and technology V.Krasnopolsky, "Nonlinear Statistics and NNs"
Atmospheric and Oceanic NN Applications • Satellite Meteorology and Oceanography • Classification Algorithms • Pattern Recognition, Feature Extraction Algorithms • Change Detection & Feature Tracking Algorithms • Fast Forward Models for Direct Assimilation • Accurate Transfer Functions (Retrieval Algorithms) • Predictions • Geophysical time series • Regional climate • Time dependent processes • Accelerating and Inverting Blocks in Numerical Models • Data Fusion & Data Mining • Interpolation, Extrapolation & Downscaling • Nonlinear Multivariate Statistical Analysis • Hydrological Applications V.Krasnopolsky, "Nonlinear Statistics and NNs"
Developing Fast NN Emulations for Parameterizations of Model Physics Atmospheric Long & Short Wave Radiations V.Krasnopolsky, "Nonlinear Statistics and NNs"
General Circulation ModelThe set of conservation laws (mass, energy, momentum, water vapor, ozone, etc.) • First Priciples/Prediction 3-D Equations on the Sphere: • - a 3-D prognostic/dependent variable, e.g., temperature • x - a 3-D independent variable: x, y, z & t • D - dynamics (spectral or gridpoint) • P - physics or parameterization of physical processes (1-D vertical r.h.s. forcing) • Continuity Equation • Thermodynamic Equation • Momentum Equations Height 3-D Grid Lon Lat V.Krasnopolsky, "Nonlinear Statistics and NNs"
General Circulation ModelPhysics – P, represented by 1-D (vertical) parameterizations • Major components of P = {R, W, C, T, S}: • R - radiation (long & short wave processes) • W – convection, and large scale precipitation processes • C - clouds • T – turbulence • S – surface model (land, ocean, ice – air interaction) • Each component of P is a 1-D parameterization of complicated set of multi-scale theoretical and empirical physical process models simplified for computational reasons • P is the most time consuming part of GCMs! V.Krasnopolsky, "Nonlinear Statistics and NNs"
Distribution of Total Climate Model Calculation Time Current NCAR Climate Model (T42 x L26): 3 x 3.5 Near-Term Upcoming Climate Models (estimated) : 1 x 1 V.Krasnopolsky, "Nonlinear Statistics and NNs"
Generic Problem in Numerical ModelsParameterizations of Physics are Mappings x1 y1 x2 y2 F y3 x3 Parameterization ym xn GCM Y=F(X) V.Krasnopolsky, "Nonlinear Statistics and NNs"
Generic Solution – “NeuroPhysics” Accurate and Fast NN Emulation for Physics ParameterizationsLearning from Data Original Parameterization GCM NN Emulation F FNN Y X Training Set …, {Xi, Yi}, … Xi Dphys NN Emulation FNN Y X V.Krasnopolsky, "Nonlinear Statistics and NNs"
NN for NCAR CAM Physics CAM Long Wave Radiation • Long Wave Radiative Transfer: • Absorptivity & Emissivity (optical properties): V.Krasnopolsky, "Nonlinear Statistics and NNs"
NN Emulation Numerical Performance is Determined by: NC of NN emulation Functional Complexity (FC) of OP, i.e. Complexity of I/O Relationship: Y = F(X) OP Numerical Performance is Determined by: Numerical complexity (NC) of OP Complexity of OP Mathematics Complexity of Physical Processes Magic of NN performance Original Parameterization NN Emulation Xi Yi Xi Yi Y = F(X) YNN = FNN(X) • Explanation of Magic of NN Performance: • Usually, FC of OP << NC of OP AS A RESULT • NC of NN Emulation ~ FC of OP and NC of NN Emulation << NC of OP V.Krasnopolsky, "Nonlinear Statistics and NNs"
Neural Network for NCAR LW RadiationNN characteristics • 220 Inputs: • 10 Profiles: temperature; humidity; ozone, methane, cfc11, cfc12, & N2Omixing ratios, pressure, cloudiness, emissivity • Relevant surface characteristics: surface pressure, upward LW flux on a surface - flwupcgs • 33 Outputs: • Profile of heating rates (26) • 7 LW radiation fluxes: flns, flnt, flut, flnsc, flntc, flutc, flwds • Hidden Layer:One layer with 50 to 300 neurons • Training: nonlinear optimization in the space with dimensionality of 15,000 to 100,000 • Training Data Set: Subset of about 200,000 instantaneous profiles simulated by CAM for the 1-st year • Training time: about 2 to 40 days (SGI workstation) • Training iterations: 1,500 to 8,000 • Validation on Independent Data: • Validation Data Set (independent data): about 200,000 instantaneous profiles simulated by CAM for the 2-nd year V.Krasnopolsky, "Nonlinear Statistics and NNs"
Neural Network for NCAR SW RadiationNN characteristics • 451 Inputs: • 21 Profiles: specific humidity, ozone concentration, pressure, cloudiness, aerosol mass mixing ratios, etc • 7 Relevant surface characteristics • 33 Outputs: • Profile of heating rates (26) • 7 LW radiation fluxes: fsns, fsnt, fsdc, sols, soll, solsd, solld • Hidden Layer:One layer with 50 to 200 neurons • Training: nonlinear optimization in the space with dimensionality of 25,000 to 130,000 • Training Data Set: Subset of about 100,000 instantaneous profiles simulated by CAM for the 1-st year • Training time: about 2 to 40 days (SGI workstation) • Training iterations: 1,500 to 8,000 • Validation on Independent Data: • Validation Data Set (independent data): about 100,000 instantaneous profiles simulated by CAM for the 2-nd year V.Krasnopolsky, "Nonlinear Statistics and NNs"
NN Approximation Accuracy and Performance vs. Original Parameterization V.Krasnopolsky, "Nonlinear Statistics and NNs"
Error Vertical Variability Profiles RMSE Profiles in K/day RMSE profiles in K/day V.Krasnopolsky, "Nonlinear Statistics and NNs"
Individual Profiles Black – Original Parameterization Red – NN with 100 neurons Blue – NN with 150 neurons PRMSE = 0.18 & 0.10 K/day PRMSE = 0.05 & 0.04 K/day PRMSE = 0.11 & 0.06 K/day V.Krasnopolsky, "Nonlinear Statistics and NNs"
NCAR CAM-2: 10 YEAR EXPERIMENTS • CONTROL: the standard NCAR CAM version (available from the CCSM web site) with the original Long-Wave Radiation (LWR) (e.g. Collins, JAS, v. 58, pp. 3224-3242, 2001) • LWR/NN: the hybrid version of NCAR CAM with NN emulation of the LWR (Krasnopolsky, Fox-Rabinovitz, and Chalikov, 2005, Monthly Weather Review, 133, 1370-1383) V.Krasnopolsky, "Nonlinear Statistics and NNs"
PRESERVATION of Global Annual Means V.Krasnopolsky, "Nonlinear Statistics and NNs"
NCAR CAM-2 Zonal Mean U10 Year Average – Original LWR Parameterization - NN Approximation - Difference (a) – (b), contour 0.2 m/sec all in m/sec V.Krasnopolsky, "Nonlinear Statistics and NNs"
NCAR CAM-2 Zonal Mean Temperature10 Year Average – Original LWR Parameterization - NN Approximation - Difference (a) – (b), contour 0.1K all in K V.Krasnopolsky, "Nonlinear Statistics and NNs"
NCAR CAM-2 Total Cloudiness10 Year Average – Original LWR Parameterization - NN Approximation - Difference (a) – (b), all in fractions V.Krasnopolsky, "Nonlinear Statistics and NNs"
NCAR CAM-2 Total Precipitation10 Year Average – Original LWR Parameterization - NN Approximation - Difference (a) – (b), all in mm/day V.Krasnopolsky, "Nonlinear Statistics and NNs"
How to Develop NNs:An Outline of the Approach (1) • Problem Analysis: • Are traditional approaches unable to solve your problem? • At all • With desired accuracy • With desired speed, etc. • Are NNs well-suited for solving your problem? • Nonlinear mapping • Classification • Clusterization, etc. • Do you have a first guess for NN architecture? • Number of inputs and outputs • Number of hidden neurons V.Krasnopolsky, "Nonlinear Statistics and NNs"
How to Develop NNs:An Outline of the Approach (2) • Data Analysis • How noisy are your data? • May change architecture or even technique • Do you have enough data? • For selected architecture: • 1) Statistics => N1A > nW • 2) Geometry => N2A > 2n • N1A < NA < N2A • To represent all possible patterns => NRNTR = max(NA, NR) • Add for test set: N = NTR × (1 +τ ); τ > 0.5 • Add for validation: N = NTR × (1 + τ + ν); ν > 0.5 V.Krasnopolsky, "Nonlinear Statistics and NNs"
How to Develop NNs:An Outline of the Approach (3) • Training • Try different initializations • If results are not satisfactory, then goto Data Analysis or Problem Analysis • Validation (must for any nonlinear tool!) • Apply trained NN to independent validation data • If statistics are not consistent with those for training and test sets, go back to Training or Data Analysis V.Krasnopolsky, "Nonlinear Statistics and NNs"
Conclusions • There is an obvious trend in scientific studies: • From simple, linear, single-disciplinary, low dimensional systems • To complex, nonlinear, multi-disciplinary, high dimensional systems • There is a corresponding trend in math & statistical tools: • From simple, linear, single-disciplinary, low dimensional tools and models • To complex, nonlinear, multi-disciplinary, high dimensional tools and models • Complex, nonlinear tools have advantages & limitations: learn how to use advantages & avoid limitations! • Check your toolbox and follow the trend, otherwise you may miss the train! V.Krasnopolsky, "Nonlinear Statistics and NNs"