Download
1 / 53
530 likes | 650 Views
What May Have Occurred Had Hurricane Ivan Made Landfall Within the Tampa Bay Region?. R.H. Weisberg and L. Zheng Tampa Bay Chapter of AMS 6/6/06. What is a storm surge? Abnormal sea level elevations (or depressions) caused by winds and atmospheric pressure. The components are:

E N D
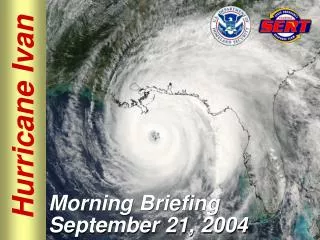
What May Have Occurred Had Hurricane IvanMade Landfall Within the Tampa Bay Region? R.H. Weisberg and L. Zheng Tampa Bay Chapter of AMS 6/6/06
What is astorm surge? Abnormal sea level elevations (or depressions) caused by winds and atmospheric pressure. The components are: 1. Coastal set up (down) by the along shore wind stress. In deep water, the Earth’s rotation causes a water to move at a right angle the wind stress. This sets up a sea level slope against the coast and an alongshore current in geostrophic balance. With the current limited by friction the sea level set up is less than a meter. 2. Coastal set up (down) by atmospheric pressure. Atmospheric pressure operates like an inverted barometer. Each mbar of pressure drop (increase) raises (lowers) sea level by 1 cm. The largest hurricanes with pressure drops of 100 mbar can cause a 1m surge by this mechanism. 3. Coastal set up (down) by the across shore wind stress. In shallow water, and because of friction, the wind stress drives water downwind and piles it up against the coastline. The resulting sea surface slope (tending to balance the across shore wind stress) is the largest contributor to coastal storm surge and can exceed several m.
Other Factors 4. Coastal geometry. By varying fetch and direction relative to a hurricane the embayment geometry is very important, as are the water depths and land elevations. 5. Continental shelf width. In shallow water the sea surface slope required to balance the across shelf wind stress is inversely proportional to water depth. Hence wide, shallow shelves are prone to larger storm surges. 6. Tides. Water level will be higher (lower) at high (low) tide. Since tides in Tampa Bay are about plus and minus 1.5’ this is small relative to the storm surge. 7. Water density. By being lighter, warmer water in summer stands higher than colder water in winter. This can amount to about 1’. 8. Waves. Waves are additive to surge. Theoretically a solitary wave can be 1.8 times the water depth. While this is not naturally realized, waves can have a huge impact. Imagine the surf zone on a very rough day displaced to Gulf Blvd.
Why should we study the potential for Tampa Baystorm surges? 1. The Southeast U.S. and the Gulf of Mexico are regularly impacted by hurricanes. 2. Whereas Tampa Bay has not had a major hurricane hit since 1921 it seems inevitable that one will occur again. 3. In the meanwhile population has grown and coastal development has burgeoned. 4. Since the region is low lying the potential for property damage and loss of life is severe.
Hurricane Storm Surge Simulation Requirements 1) A high resolution, physics-based circulation model with flooding and drying capabilities. 2) A high resolution water depth (bathymetry) and land elevation data set on which to overlay the model. 3) Accurate enough wind and pressure fields to drive the model.
The Model We use the Finite Volume Coastal Ocean Model (FVCOM) of Chen at al. (2003). The FVCOM attributes are: • An unstructured triangle grid for representing complex coastal geometry. • Three-dimensional, primitive equations, with flow dependent turbulence closure. • Finite-differences for mass, momentum, heat, and salt conservation, plus computational efficiency. • Provision for flooding and drying land.
Wind and Pressure Distributions for a Prototypical Hurricane (Holland, 1980)
The Ivan track (red dots) and the tracks (black dots) used in our study (with landfalls as Sarasota, Indian Rocks Beach, Tarpon Springs, Bayport, and Cedar Keys
Ivan Winds on approach and at Landfall While Ivan reached category 5 in the Caribbean it was a 4 upon approach and a 3 at landfall. Categorymphknotsm/s 1 74-95 64-82 33-43 2 96-110 83-95 44-49 3 111-130 96-113 50-59 4 131-155 113-135 60-70 5 >155 >135 >70
Details of the Indian Rocks Beach Landfall Experiment. • The entire Tampa Bay region. • Zoom views of the Pinellas beaches, Old Tampa Bay, and Hillsborough Bay. • Two methods of display are used: • Surge relative to mean sea level • Inundation relative to land
Relative Elevations (Approximate) Seawall height (and nominal street level): 5’ above mean low water (MLW); 4’ above mean sea level (MSL); Finished floor heights: 9’ and 11’ above MLW for old and new building codes (8’ and 10’ above MSL (7’ and 9’ above MHW); hence a 2.5m (3m) surge would put water in an older (newer) home. New building code Old building code Seawall and road levels 11 ft 9 ft 4 ft Meters and Feet 1m = 3.28 ft 3m = 9.84 ft 6m = 19.68 ft 5 ft MSL 1 ft MLW
Surge elevation relative to mean sea level (left) and wind speed and direction (right) 6 hrs before landfall
Surge elevation relative to mean sea level (left) and wind speed and direction (right) 3 hrs before landfall
Surge elevation relative to mean sea level (left) and wind speed and direction (right) at landfall
Surge elevation relative to mean sea level (left) and wind speed and direction (right) 1 hr after landfall
Surge elevation relative to mean sea level (left) and wind speed and direction (right) 2 hrs after landfall
Animations of surge height relative to mean sea level (left) and winds (right)
Surge elevation relative to land elevation (left) and wind speed and direction (right) 6 hrs before landfall
Surge elevation relative to land elevation (left) and wind speed and direction (right) 3 hrs before landfall
Surge elevation relative to land elevation (left) and wind speed and direction (right) at landfall
Surge elevation relative to land elevation (left) and wind speed and direction (right) 1 hr after landfall
Surge elevation relative to land elevation (left) and wind speed and direction (right) 2 hrs after landfall
Animations of surge height relative to land elevation (left) and winds (right)
Zoom views for the Pinellas beaches of inundation relative to land elevation
Highest surge relative to land elevation for this sub-region
Animation of surge relative to land elevation for this sub-region
Zoom views for Old Tampa Bay of inundation relative to land elevation
Highest surge relative to land elevation for NE St. Petersburg
Highest surge relative to land elevation for upper Old Tampa Bay
Animation of surge relative to land elevation for this sub-region
Zoom views for Hillsborough Bay of inundation relative to land elevation
Animation of surge relative to land elevation for this sub-region
What might have happened if the landfall point occurred elsewhere? Tarpon Springs Bayport Cedar Keys Sarasota
ENCORE The worst case for Tampa Bay as a whole is not necessarily the worst case for any given position within the bay. Now consider the inundation potential for downtown Tampa under a category 5 hurricane paralleling the bay axis and displaced northwest by a radius to maximum winds, such that the maximum winds are directed toward the head of Hillsborough Bay.
Time series of surge height sampled at selected locations Key 9m=30’