Download
1 / 37
370 likes | 382 Views
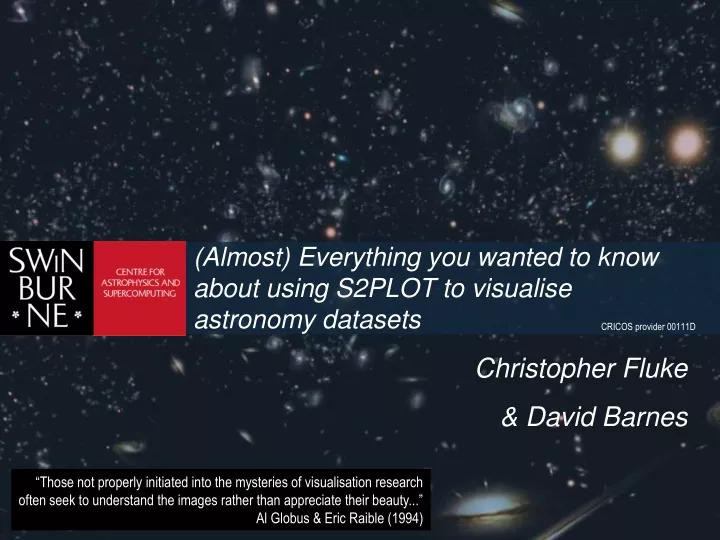
(Almost) Everything you wanted to know about using S2PLOT to visualise astronomy datasets. CRICOS provider 00111D. Christopher Fluke & David Barnes.

E N D
(Almost) Everything you wanted to know about using S2PLOT to visualise astronomy datasets CRICOS provider 00111D Christopher Fluke & David Barnes “Those not properly initiated into the mysteries of visualisation research often seek to understand the images rather than appreciate their beauty...” Al Globus & Eric Raible (1994)
What is Visualisation? • The process of creating (computer-generated) images in order to gain new understanding or insight into data. Visualisation System Knowledge discovery Data Science (Almost) Everything you wanted to know about S2PLOT...
Astronomical Data • Brunner et al. (2001): • Imaging data: 2D, narrow , fixed epoch • Catalogs: secondary parameters determined from processing (coordinates, fluxes, sizes, etc). • Spectroscopic data and products (e.g. redshifts, chemical composition). • Studies in the time domain - moving objects, variable and transient sources (synoptic surveys) • Numerical simulations from theory Planning, data collection, reduction, comprehension Many astronomical datasets have N > 3 (Almost) Everything you wanted to know about S2PLOT...
The rest of this presentation... • What is S2PLOT? • Getting started • Geometry • Points, lines, coordinates, labels, text • Spheres, cubes, polygons • Colour and colour maps • Static versus dynamic geometry: S2PLOT callbacks • Billboards/splats • Handles • Nice fonts • Volume rendering, isosurfaces • Other media • 3d-PDF, Web, s2slides (Almost) Everything you wanted to know about S2PLOT...
Introducing S2PLOT • AIMto enable visualization-led scientific discovery • BYmaking an easy-to-use programming library • THAT WORKS ONthe astronomer’s desktop workstation • AND WITHOUT RECOMPILATION ONadvanced display devices • RESULT S2PLOT: Barnes et al., 2006, PASA, 23, 82 www.astronomy.swin.edu.au/s2plot (Version 2.4) (Almost) Everything you wanted to know about S2PLOT...
Key Features and Benefits • Supports standard and enhanced displays • Real-time interaction • Mouse + keyboard navigation • Static and dynamic data • Runs on Apple/OSX, GNU/Linux and Windows (GNU/cygwin) • C/C++, Fortran and Python • PGPLOT-inspired programming interface (Almost) Everything you wanted to know about S2PLOT...
A Practical Example (Almost) Everything you wanted to know about S2PLOT...
A Practical Example (Almost) Everything you wanted to know about S2PLOT...
A Practical Example (Almost) Everything you wanted to know about S2PLOT...
A Practical Example (Almost) Everything you wanted to know about S2PLOT...
A Practical Example • 2-d views of multi-d data • Colour-colour • Colour-magnitude (Almost) Everything you wanted to know about S2PLOT...
A Practical Example (Almost) Everything you wanted to know about S2PLOT...
Initialise Create geometry lists Register callback functions S2PLOT Program Flow Handle window events Handle user events Process callbacks Draw geometry using OpenGL lists (Almost) Everything you wanted to know about S2PLOT...
An easy s2plot program (in C) (Almost) Everything you wanted to know about S2PLOT...
An easy s2plot program (in C) (Almost) Everything you wanted to know about S2PLOT...
An easy s2plot program (in C) (Almost) Everything you wanted to know about S2PLOT...
An easy s2plot program (in C) (Almost) Everything you wanted to know about S2PLOT...
An easy s2plot program (in C) (Almost) Everything you wanted to know about S2PLOT...
An easy s2plot program (in C) (Almost) Everything you wanted to know about S2PLOT...
Comiple and Execute • Configure your S2PLOT environment... • cbuild.csh s2example • ./s2example (Almost) Everything you wanted to know about S2PLOT...
Programming Reference http://astronomy.swin.edu.au/s2plot (Almost) Everything you wanted to know about S2PLOT...
Sample code for every function (Almost) Everything you wanted to know about S2PLOT...
PGPLOT versus Native functions (Almost) Everything you wanted to know about S2PLOT...
Example: Points and lines (Almost) Everything you wanted to know about S2PLOT...
Example: spheres and polygons (Almost) Everything you wanted to know about S2PLOT...
Example: text (Almost) Everything you wanted to know about S2PLOT...
Static versus Dynamic geometry • Static geometry • Draw it once • Dynamic • Redraw on every display refresh • Animation! • Advanced interaction: mouse click events, key presses, iPod • Geometry that depends on camera angle • Callbacks (Almost) Everything you wanted to know about S2PLOT...
Billboards & Splats • Billboards: (2-d) things which always face the camera • good for labels & markers • Splats: billboards which are soft point-like textures (images) • visually appealing alternative to single-pixel points • star fields, stellar clusters • variable size and colour with good blending properties • simulated particle distributions • thresholded, gridded volume data • Billboards have to be redrawn whenever the camera moves, so they must only be created in a callback function. (Almost) Everything you wanted to know about S2PLOT...
Billboards & Splats: Example (Almost) Everything you wanted to know about S2PLOT...
Nice Fonts • As in PGPLOT, the basic font in S2PLOT is a "Hershey" font • vector-based • functional & fast, but inelegant • S2PLOT provides 2 better ways to create text labels • unsigned int ss2ltt(char *latexcmd, float *aspect); • uses LaTeX to generate a bitmap which is converted into an S2PLOT texture for you. (Requires a few environment variables to be set correctly - see ENVIRONMENT.TXT in S2PLOT) • nice for equations • unsigned int ss2ftt(char *fontfilename, char *text, int fontsizepx, int border); • uses the FreeType2 font engine to generate a bitmap which is converted into an S2PLOT texture for you. (Almost) Everything you wanted to know about S2PLOT...
Nice Fonts: Example (Almost) Everything you wanted to know about S2PLOT...
Handles • Handles provide user interaction • they can be displayed or hidden with Shift-S • your code can be alerted when a handle is clicked on • your code can be alerted when a handle is dragged • Handles have: • a position in 3-d space, and a size (fraction of the screen) • a texture and colour for their "unselected" state • a texture and colour for their "selected" state • You can make invisible handles and draw other geometry at their location if you want. (Almost) Everything you wanted to know about S2PLOT...
Handles (continued) • Possible uses for handles: • select points in a displayed dataset • select galaxies or stars or planets in a visualisation • define a 3-d region (volume selection) • provide buttons and sliders and even menus • this is typically done in "screen coordinates" mode • allow users to define control points along a spline camera path • etc. (Almost) Everything you wanted to know about S2PLOT...
Isosurfaces and Volume Rendering Data courtesy J.English (Almost) Everything you wanted to know about S2PLOT...
Colour maps • Computers generate colours through R G B combinations • 24-bit RGB = 16,777,216 (256³ or 224) colours • Colour can enhance important features • Can exaggerate unimportant details • Try different colour maps (Almost) Everything you wanted to know about S2PLOT...
Other media • 3-d PDF Barnes, D.G., Fluke, C.J. 2008, Incorporating interactive 3-dimensional graphics in astronomy research papers, New Astronomy, 13, 599 Fluke, C.J., Barnes, D.G. 2008, The Interactive Astronomy Textbook, Astronomy Education Review, 7, 113 • Web Fluke, C.J., Barnes, D.G., Jones, N.T. 2009, Interchanging Interactive 3-d Graphics for Astronomy, Publications of the Astronomical Society of Australia, accepted, arXiv:0810.4201F • s2slides: “PowerPoint”-style presentations (Almost) Everything you wanted to know about S2PLOT...
Where to next? • Try some S2PLOT sample code • http://astronomy.swin.edu.au/s2plot • Take part in the hands-on workshop • Talk to me about your data (Almost) Everything you wanted to know about S2PLOT...