Download
1 / 19
200 likes | 220 Views
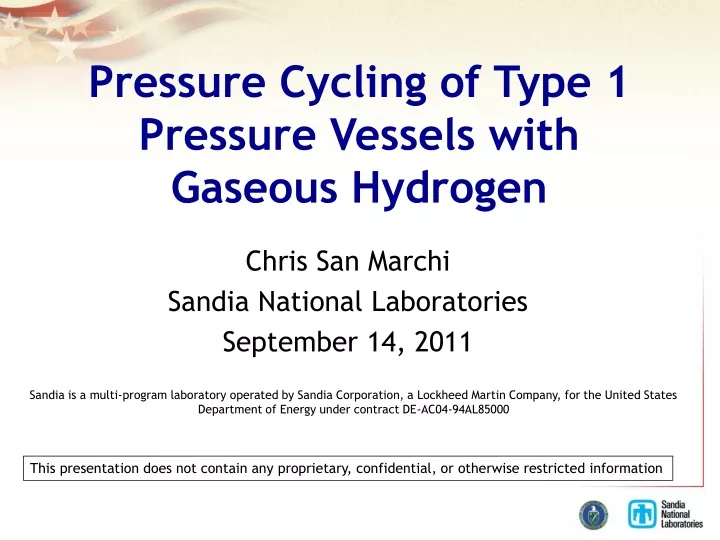
Pressure Cycling of Type 1 Pressure Vessels with Gaseous Hydrogen. Chris San Marchi Sandia National Laboratories September 14, 2011.

E N D
Pressure Cycling of Type 1 Pressure Vessels with Gaseous Hydrogen Chris San Marchi Sandia National Laboratories September 14, 2011 Sandia is a multi-program laboratory operated by Sandia Corporation, a Lockheed Martin Company, for the United States Department of Energy under contract DE-AC04-94AL85000 This presentation does not contain any proprietary, confidential, or otherwise restricted information
Outline and Objectives • Demonstrate performance test method for evaluating compatibility of pressure vessel with gaseous hydrogen • Determine failure characteristics of commercial pressure vessels • Do the pressure vessels leak-before-burst when cycled with gaseous hydrogen? • Compare full-scale testing for steel (type 1) pressure vessels for gaseous hydrogenwith engineering design methods • Fracture mechanics-based design • Stress-life design
Fracture and fatigue resistance of steels is degraded by exposure to hydrogen Motivation: innovative applications are expanding design space beyond engineering experience >10,000 refueling cycles are anticipated for hydrogen-powered industrial trucks Hydrogen-induced failure of transport cylinder Ref.: Barthélémy, 1st ESSHS, 2006
Pressure cycle designed for accelerated testing • Consider 350 bar gaseous hydrogen fuel system • Nominal pressure of 35 MPa • Allow 25% over-pressure during rapid filling • Minimum system pressure of ~3 MPa Pressure cycle for testing • maximum P = 43.5 MPa • 2-minute hold at maximum P • rapid depressurization to 3 MPa • 30-second hold at minimum P • pressurization time ~ 2 min 4 to 5 minute cycle time (~300 cycles per day)
Closed-loop gas-handling system capable of simultaneously pressurizing 10 pressure vessels Pressure vessels in secondary containment behind blast door Accumulators (behind compressor) Pressure cycle High-volume diaphragm compressor
Free volume within vessels reduced to facilitate pressure cycling • Bladder used to isolate PV surface from filler material • • Epoxy and steel used as filler • • Volume reduction 90-95% • • Gas quality inspected periodically • typical analysis • oxygen <2 ppm • hydrocarbons <5 ppm • water <5 ppm Sectioned pressure vessel showing vessel, bladder, steel ball bearings and epoxy
Pressure vessels consistent with design rules for transportable gas cylinders Typical design rule: maximum wall stress <40% of UTS • Two pressure vessel designs from different manufacturers • Nominal hoop stress at P = 43.5 MPa • - T1 design: ~340 MPa • - T2 design: ~305 MPa • Steel for both pressure vessels designs: 4130X • Quench and tempered, 1 wt% Cr - 0.25 wt% Mo • UTS for transport applications: 700 to 900 MPa • - T1 design: ~750 MPa • - T2 design: ~850 MPa
Engineered defects used to initiate failures Engineered defect (10 per vessel) Elliptical engineered defect Aspect ratio = 1/3 (depth/length) V-notch in profile Nominal root radius 0.05mm (actual ~0.12mm) • Depth of engineered defects • Typically all 10 defects similar for a given vessel • Smallest defects ~2% of wall thickness • Largest defects ~10% of wall thickness • For one vessel, aspect ratios were 1/2 and 1/12
Large engineered defects initiated cracking and hydrogen-assisted failure Summary of hydrogen pressure cycling and defect sizes
Commercial pressure vessels exceed lifetime target of 11,250 cycles by >3x • Each pressure vessel with engineered defects contains 10 nominally equivalent defects • Arrows indicate pressure vessels that did not fail • In failed vessels, all defects initiate a crack • All failures (4) are leak before burst T1-07 T1-10 T1-08 T2-04
All observed failures are leak-before-burst • All failures occur during pressure ramp • At failure, pressure vessel “slowly” leaks gas into secondary containment • After failure, vessels can be pressurized to ~10 MPa without leakage • Through-wall crack cannot be detected visually
Through-wall cracks extend from “critical” engineered defect T1-07 wall thickness engineered defect T1-10 wall thickness
Cracks extend from all engineered defects • Smaller engineered defect • Greater number of cycles = more crack extension Same size engineered defect (same vessel) Non-through-wall (growing) cracks have semicircular profile Through-wall crack
Fracture mechanics provides a methodology for predicting crack growth p frequency ∆p ∆K time Fracture mechanics implies that single parameter uniquely characterizes the cracking response Dp HH HH a Flaw size, a HH HH • Stress intensity factor (K) depends on pressure/load (p) and size of the crack (a) • ∆K determines fatigue crack growth (da/dN) Number of pressure cycles, N In the laboratory, one can measure the material’s response to fatigue da/dN = f (∆K) And integrate for a known geometry ai+1 = ai + (da/dN)i ∆N
Fatigue crack in gaseous hydrogen is an order of magnitude greater than in air • Fatigue crack growth rates measured in gaseous hydrogen at pressure of 45 MPa • 3 heats of 4130X steel from pressure vessels • (unlike fracture resistance, fatigue crack growth in ferritic steels appears to be insensitive to hydrogen pressure)
Fracture mechanics is overly conservative when defects are not initially growing • Curves are predictions based on crack growth only (of semicircular flaw) • Arrows indicate vessels that did not fail • Failures use measured dimensions (others assume nominal dimensions) • Predictions underestimate experiments by >2x or more • Size of vessel wall and size of propagating defect are relatively unimportant Crack initiation is important!
Fatigue life methods offer framework for incorporating crack initiation “smooth” notched • •Idealized S-N curves based on • - Materials properties: • Su and Sfl • - Geometry and loading: • Kf and Sm • • Data for Cr-Mo steels suggestsSfl (H2) ≈ Sfl (air) • • Stress amplitude for tested vessels <250 MPa • Kf ~ 1.4 for engineered defect of ~5% depth • • Estimated number of cycles to failure >> 105
ASME code provides design curves for fatigue evaluation of pressure vessels Design curves are conservative with respect to measured S-N curves • Proposed requirements for type 1 steel pressure vessels in gaseous hydrogen service • • Cr-Mo steel with Su < 875 MPa • Wall stress < 0.4Su • Use ASME code to predict design lifetime Engineering Significance - Wall stress < 350 MPa - Stress amplitude generally < 250 MPa
Summary • Vessels being used for hydrogen storage have been subjected to more than 55,000 pressure cycles with gaseous hydrogen at a peak pressure of 43.5 MPa • Engineered defects with depth >6% of the wall thickness initiated failure after 8,000 and 15,000 cycles • Leak-before-burst was observed for all failures • Fatigue crack growth assessment is overly conservative for idealized defects • Cycles to failure due to engineered defects is >2 times prediction • Crack initiation dominates the cycle life even with internal notches • Fatigue life curves based on testing in air are being considered for design of hydrogen pressure vessels