Download

1 / 27
270 likes | 282 Views
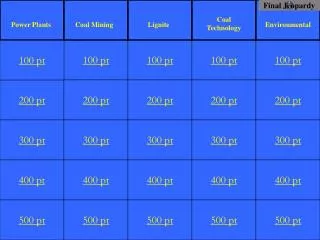
Jeopardy. Sets of Numbers/Venn Diagrams. Logic. Probability. Statistics. Geometry. 100. 100. 100. 100. 100. 200. 200. 200. 200. 200. Jeopardy. 300. 300. 300. 300. 300. 400. 400. 400. 400. 400. 500. 500. 500. 500. 500. U = {2, 3, 4 ,5, 6, 7, 8, 9, 10}

E N D
Sets of Numbers/Venn Diagrams Logic Probability Statistics Geometry 100 100 100 100 100 200 200 200 200 200 Jeopardy 300 300 300 300 300 400 400 400 400 400 500 500 500 500 500
U = {2, 3, 4 ,5, 6, 7, 8, 9, 10} A, B, and C are subsets of U; A = {factors of 20} B = {prime numbers} C = {3, 4, 5, 6} List the elements of a) A B b) A B’ c) (A B) C
Place the values in the appropriate space on the Venn Diagram if U = {Real Numbers}, P = {Positive Numbers}, and Q = {Rational Numbers} -3, 2.3 x 10⁻³, sin 60°,1.2 x 106, π, Q P U
In a group of 30 students, 18 take the Mathematical Studies course and 14 take a Biology course. 7 students don’t take Mathematical Studies or Biology. A) Make a Venn Diagram that displays the above information. b) Find the number who study both Mathematical Studies and Biologyc)the probability that a student chosen at random studies Biology given that the student does not study Mathematical Studies.
There are 24 students in a class. 14 study Biology and 8 study Chemistry. 6 don’t study either of those two subjects. A) How many students study Biology and Chemistry? B) If a student is chosen at random, find the probability that the student studies Chemistry or Biology but not both.
U = {2, 3, 4, 5, 6, 7, 8, 9, 10} A = {multiples of 3} B = {2, 5, 6, 7, 9} C = {4, 5, 6, 8} (A, B, and C are subsets of U)a) Draw a Venn Diagram to illustrate these sets. b i) List the elements of A’ B . ii) Find n(B U C’)ci ) An element of U is chosen at random. Find the probability it is an element of A or C. ii) An element of B is chosen at random. Find the probability it is not an element of A
A number is chosen at random from the list below: 2 3 6 8 9 11 12 13 Find the probability that: a) the number is prime, b) the number is greater than 7, given it is less than 10.
Two unbiased 6 sided dice are thrown and the scores are added.a) Draw a diagram of the sample spaceb) Find the probability that the total is 9 or more, given neither die shows a 1
Two people independently write down a digit from 0 to 9 at random. Find the probability that: a) both people write a ‘5’.b) neither person writes a ‘5’c) one person writes a ‘5’ and the other does not
In her purse a woman has the following bills: $5 $10 $20 $50 She selects two bills at random. a) List the sample space. b) Find the probability that she has less than $50 in her hand.
1/8 R 2/9 G R B G B In a box there are 2 red cards, 4 green cards, and 3 blue cards. A card is chosen at random at not replaced, then a second card is chosen at random. A) Explain the entry 1/8 in the tree diagram. B) Copy and complete the tree diagram. C) Find the probability that: i) both cards are blueii) the two cards are the same coloriii) one card is green and the other is blue. D) (i) Find the probability that the second card is blue. (ii) Hence find the probability that the first card was blue, given that the second card is blue.
P: the integer N is less than 20q: the integer N is less than 12r: the integer N is greater than 20. True or false? (a) (b) ( c)
A, B, and C are all different ages. Three propositions are: p: A is older than Bq: B is younger than Cr: A is older than C(a) Write in simple English the meaning of (b) If A is 16, B is 18 and C is 15 years old, which of the following propositions are true?(i) (ii) (iii)
Three propositions are: r: it is raining s: it is not snowing w: it is windy(a) Write the following as simple English sentences: (i)(ii)(iii)(b) Write in symbol form: (i) if it is not windy, then it is raining(ii) it is snowing or raining (c) In simple English, give the converse of
The weights w grams of letters leaving an office were measured. The grouped data are below: Find the five number summary of this data
This stem and leaf graph shows the ages of people at a meeting: • Find the median age • Find the range of the ages
The weights (in kilograms) of a group of 9 children were: 44 51 38 36 62 55 32 43 47(a) Find: (i) the range of the weights(ii) the standard deviation of the weights(iii) the interquartile range of the weights
At a certain school students sit two end of year mathematics exams, Paper 1 (with 40 marks) and Paper 2 (with 60 marks). The table below shows the scores of six students: • What is the line of best fit for this set of data? • What is the correlation coefficient? • What does the correlation coefficient tell you about the data?
A company which manufactures light bulbs surveyed the lifetimes, t hours of 60 bulbs. The results are shown in the table below. • Construct a cumulative frequency graph illustrating the information. Use a scale of 1 cm to 200 hours on the x-axis, and 1 cm to 5 bulbs on the y-axis. • From your graph estimate • (i) the median lifetime • (ii) the 70th percentile
C 10 cm 8 cm 50° A D B Given the following triangle:(a) Calculate length CD(b) Calculate length DB
C A D In the right prism illustrated above, AB = 10cm, AC = 13cm, and BD = 20 cm. (a) Calculate the vertical height of the solid. (b) Calculate the volume of the solid. B
In the diagram AD = 15 cm, BD = 11 cm and CD = 6 cm Find: (a) the length AC(b) the length AB D A B C
C B 50° A D The diagram shows a quadrilateral piece of fenced land, ABCD. Fence AB and AD are perpendicular. AB = 55m, AD = 45m, CD = 65m and angle BDC = 50° • Calculate the length of line BD. • Calculate the length of fence BC. • It is necessary to re-fence the land with fencing that cost $7.49 per metre length. What will be the cost of this correct to the nearest dollar?
In quadrilateral PQRS: PQ = 12 cm, angle SPQ = 90°, SR = 18 cm, QR = 17 cm and angle PQS = 38°.(a) show that QS = 15.23 cm correct to 2 decimal places.(b) calulate angle QRS.(c) find the area of triangle QRS. R S 38° P Q