Download
1 / 11
110 likes | 133 Views
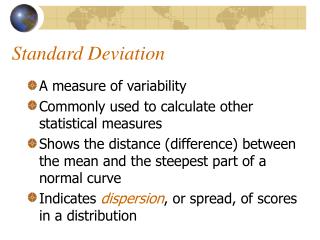
4.4 – Standard deviation. Standard deviation. The Standard Deviation is a measure of how spread out numbers are. σ (the greek letter sigma) In order to calculate the standard deviation we must first find the variance of data. variance.

E N D
Standard deviation • The Standard Deviation is a measure of how spread out numbers are. • σ (the greek letter sigma) • In order to calculate the standard deviation we must first find the variance of data
variance • The average of the squared differences from the Mean. Calculating Variance • First find the mean • Subtract the mean from each given point in the data set • Square each difference from step 2 • Calculate the meanof the difference(from step 3)
Example: Calculate the variance of the given set below.1, 2, 3, 4, 5, 6, 7 • Step 1: • Mean = 4 • Step 2 • Step 3 • Step 4 • Variance = 4
Calculating the standard deviation of a set Calculating Standard Deviation: • Calculate the Variance • Square root the variance
Example: Calculate the S.D. of the given set below.1, 2, 3, 4, 5, 6, 7 • Step 1: • Variance = 4 • Step 2: • Standard Deviation = 2
Percentages of Normal distributions • 68.2%of all data that is normally distributed should be within onestandard deviation. • 95.5%of all data that is normally distributed should be within twostandard deviation. • 99.7%of all data that is normally distributed should be within threestandard deviation.
Say which of the values above falls within one standard deviation of the mean: 2 – 6 2, 3, 4, 5, 6 5/7 = 71.43% • Say which of the values falls within two standard deviations of the mean: 0 – 8 1, 2, 3, 4, 5, 6, 7 7/7 = 100%
notation • µ is the notation of population mean (pronounced Mu) • is the notation of sample mean (pronounced x-bar) • σ is the notation of population standard deviation (pronounced sigma) • S is the notation of sample standard deviation • is the notation of population variance • is the notation of sample variance
Calculate the variance and standard deviation of the given ages of the first 10 presidents during inauguration. 57, 61, 57, 57, 58, 57, 61, 54, 68, 50 • Mean ( µ ): 58 • Variance: 1 + 9 + 1 + 1 + 0 + 1 + 9 + 16 + 100 + 64 = 202/10 = 20.2 • Standard Deviation ( σ ):
Say which of the values above falls within one standard deviation of the mean: 53.51 – 62.49 54, 57, 57, 57, 57, 58, 61, 61 8/10 80% • Say which of the values falls within two standard deviations of the mean: 49.02 – 66.98 50, 54, 57, 57, 57, 57, 58, 61, 61 9/10 90% • Say which of the values falls within three standard deviations of the mean: 44.53 – 71.47 50, 54, 57, 57, 57, 57, 58, 61, 61, 68 10/10 100% • Do your percentages show normal distribution?