Download
1 / 48
480 likes | 489 Views
Sea Breeze, Coastal Upwelling Modeling to Support Offshore Wind Energy Planning and Operations. Greg Seroka 1 , Erick Fredj 2 , Travis Miles 1 , Rich Dunk 1 , Josh Kohut 1 , Scott Glenn 1. 1. October 22, 2015 MTS/IEEE OCEANS ‘15. 2. Introduction.

E N D
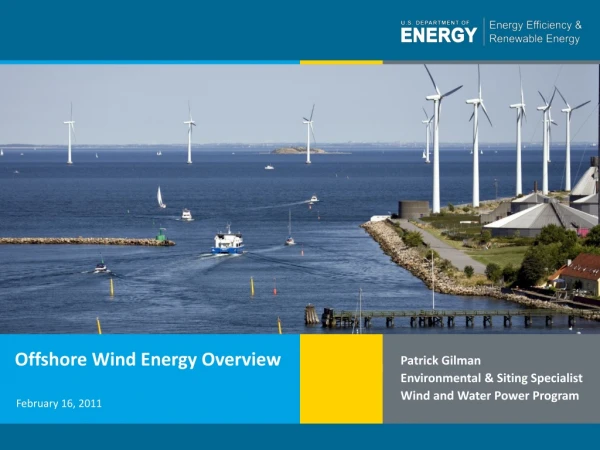
Sea Breeze, Coastal Upwelling Modeling to Support Offshore Wind Energy Planning and Operations Greg Seroka1, Erick Fredj2, Travis Miles1, Rich Dunk1, Josh Kohut1, Scott Glenn1 1 October 22, 2015MTS/IEEE OCEANS ‘15 2
Introduction • On November 9, 2015, BOEM commercial lease auction for NJ will take place • Nearly 344,000 acres for leasing offshore wind (OSW) • 5th competitive lease auction for OSW in U.S. • OSW developer(s) who win a lease zone will submit application to develop to NJ Board of Public Utilities (NJ BPU) • Must include wind resource assessment & economic analysis
Introduction • NJ sea breeze and coastal upwellingcoincident with peak electricity demand • NJ BPU Offshore Wind Rules state: “Applications shall account for…the coincidence between time of generation for the project and peak electricity demand.” Relative Load Frequency
Introduction Sea breeze Coastal upwelling
Introduction Coastal upwelling + Sea breeze Hypothesis Cold upwelling Does this occur? With or without upwelling?
Introduction Key Questions: • What effect does cold coastally-upwelled water have on the coastal/offshore wind resource? • What does the offshore component of the sea breeze look like? Secondary circulation (size, structure)? Offshore divergence? Coastal upwelling ?
Materials and Methods • Satellite: state-of-the-science declouding and compositing technique designed by Rutgers to determine SST and resolve coastal upwelling • Model: 3km, 600m WRF-ARW 3.6.1; YSU PBL; MM5 Monin-Obukhov surface layer • Advantages (vs. offshore met tower): cost, spatial variability, prediction • Sea Breeze Cases: • July 7, 2013: corkscrew, strong upwelling • July 31, 2014: corkscrew, weak upwelling • April 27, 2013: pure, no upwelling Coastal upwelling • Backdoor • Corkscrew • Pure
Weak upwelling(Actual) Methods Case 2: July 31, 2014: corkscrew, weak upwelling Strong upwelling
Results Upwelling produces an inversion, decreasing 10m winds & increasing 100m hub height winds SST Diff. 10m Wind Speed Diff. 100m Wind Speed Diff. r2=0.61 r2=0.58 Case 2: 20140731
Results Upwelling produces an inversion, decreasing 10m winds & increasing 100m hub height winds Wind Speed Difference 10m Wind Speed Diff. Case 2: 20140731
Results Upwelling produces an inversion, decreasing 10m winds & increasing 100m hub height winds Temperature Difference 10m Wind Speed Diff. Case 2: 20140731
Methods • Case 3: April 27, 2013: pure, no upwelling • Lagrangian Coherent Structures (LCSs) • LCSs are boundaries in a fluid that distinguish regions of differing dynamics (e.g. eddies, jets, fronts) • Particles move away from and along a repelling LCS (A), aggregate and move along attracting LCSs (B) • LCS maps identify convergence and divergence in a fluid flow (e.g. sea breeze)
Methods Benefits of LCS • The Lagrangian measures are advantageous as they are frame independent and robust with respect to localized noise in the data. • Additionally, LCS analysis reveals coherent structures in more detail and with better clarity than streamline plots generated from 2D wind retrieval (Chan and Shao 2007; Tang et al. 2011)
Methods LCS Set-up • On 3km WRF winds • 1800 UTC to 2300 UTC (peak sea breeze time) • 10km grid spacing for tracer trajectories • Perform at these levels in WRF: • 10, 50, 150, 500, 600, 700, 800, 900, 1000, 1500, 2000, 2500m (through marine boundary layer) • Use relative dispersion (RD) to identify LCSs
1500 UTC 1 km WRF simulation
1800 UTC 1 km WRF simulation
2100 UTC 1 km WRF simulation
0000 UTC 1 km WRF simulation
Results 10m
Vertical Cross Section Top of wind turbine Coastline Wind Energy Area Bounds
Vertical Cross Section Top of wind turbine Coastline Wind Energy Area Bounds
Summary of Part 2 Results • Divergence is slanted with height, from surface offshore to aloft onshore (agrees with theory) • Reversal in divergence/convergence, and thus approximate height size of sea breeze cell, similar onshore and offshore • Offshore: • Divergence: 10 to ~700m • Convergence: ~700 to 2000m • Onshore: • Convergence: 10 to ~600m • Divergence: ~600 to 1500m
Future Work • Hourly LCS RD maps • Divergence aligned with inland frontal progression? • LCS predictive sea breeze index • e.g. offshore surface divergence, onshore surface convergence high enough value to get sea breeze? (quick, efficient forecasting method) • 3D LCS • To account for vertical velocities • For vertical shear analysis (important for wind turbine engineering)
Key Questions • Can we use LCS to more clearly identify and characterize (horizontal & vertical extent, duration, timing, etc.) key structures within the sea breeze (areas of divergence and convergence, fronts, return flow, over water subsidence, calm zones, circulation cells)? • More importantly for offshore wind, can we use LCS to detect areas of higher turbulence and wind shear within the sea breeze, especially offshore?
Sea Breeze Cases • Case 01: July 7-8, 2013 • Corkscrew, strong upwelling • Case 02: July 31-August 1, 2014 • Corkscrew, weak upwelling • Case 03: April 27-28, 2013 • Pure, no upwelling • Pure • Corkscrew • Backdoor • Check 925 mb wind direction for sea breeze type
Sea Breeze Cases • Case 01 and Case 02: • Results coming soon • Case 03: April 27-28, 2013 • Pure, no upwelling • Results presented here • Pure • Corkscrew • Backdoor • Check 925 mb wind direction for sea breeze type
WRF Setup • WRF-ARW 3.6.1 • 3km outer nest, 600m inner nest • North American Mesoscale (NAM) initial and boundary conditions • YSU PBL • Best PBL scheme for offshore 2m T in UK, no difference for offshore winds (Steele et al 2013) • MM5 Monin-Obukhov surface layer
Therefore, speed of sea breeze front is nearly constant between 1900 and 2200 UTC • LCS linear interpolation assumption is validwill gather hourly LCS output to determine temporal evolution of LCS
More Future Work • Offshore sea breeze extent (i.e. calm zone propagation offshore) sensitivity to PBL scheme? • YSU 21km, MYNN 0km offshore for one pure sea breeze case (Steele et al 2013) • Apply LCS to scanning LIDAR winds • Combine with WRF to get back (LIDAR) and forward (WRF) trajectories for real-time structure detection and automated turbulence and wind shear warning system for offshore wind