Download
1 / 20
220 likes | 233 Views
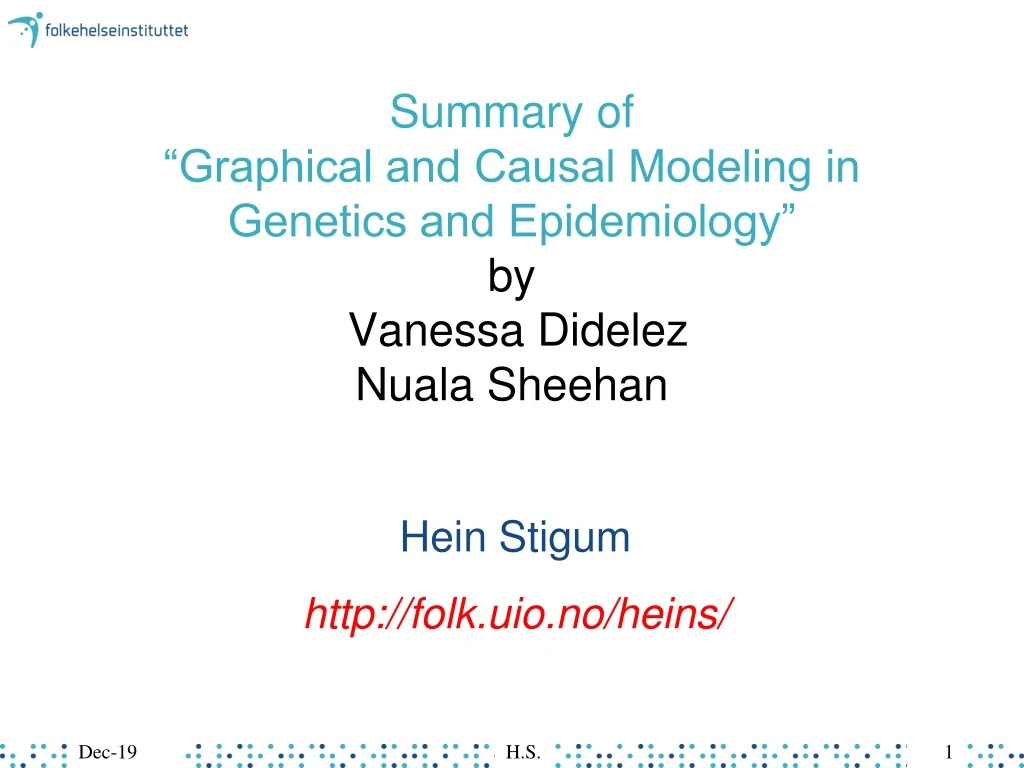
Summary of “Graphical and Causal Modeling in Genetics and Epidemiology” by Vanessa Didelez Nuala Sheehan. Hein Stigum http://folk.uio.no/heins/. Dec-19. H.S. 1. Graphical Models. Pedigrees Compute carrier probability Causal Reasoning Conditional independence Two main types

E N D
Summary of“Graphical and Causal Modeling in Genetics and Epidemiology”by Vanessa DidelezNuala Sheehan Hein Stigum http://folk.uio.no/heins/ Dec-19 H.S. H.S. 1
Graphical Models • Pedigrees • Compute carrier probability • Causal Reasoning • Conditional independence • Two main types • Undirected graphs • Directed acyclic graphs • Medelian randomization Dec-19 H.S. H.S. 2
Introduction “Close to the edge” Dec-19 H.S. H.S. 3
Associations C E D E D C E D Confounder Collider Dec-19 • E and D associated if: • E causes D • C is a common cause of E and D • C is a common effect of E and D and we condition on C Dec-19 H.S. H.S. H.S. 4 4
Marginal and conditional dependence Conditionally Independent | C Marginally dependent E and D are: Dec-19 H.S. H.S. 5
C E D Test of H0 • Can test H0 only if • E and D are conditionally independent, given the variables we adjust for (C) C E D Not OK OK Need graphic tools! Dec-19 H.S. H.S. 6
Graphic tools “We have the moral edge!” Dec-19 H.S. H.S. 7
1 4 5 2 3 Undirected Graph Definition: A and B are separated by C if all paths from A to B pass thru C Are 1 and 5 separated by 2 ? Are 1 and 5 separated by 3 ? Are 1 and 5 separated by 3 and 4 ? Yes No Yes If 1 and 5 are separated by 2, then 1 and 5 are conditionally independent given 2 Dec-19 H.S. H.S. 8
T U A Example: Chewing tobacco and ulcers T and U are marginally dependent T and U are conditionally independent given A T and U are separated by A Dec-19 H.S. H.S. 9
Directed Acyclic Graphs, DAGs 1 3 5 Are 1 and 4 separated by 2 ? No 2 4 • Steps: • Take ancestral graph of {1,2,4} • Moralize the graph • Look for separation Dec-19 H.S. H.S. 10
Directed Acyclic Graphs, DAGs 1 3 5 Are 1 and 4 separated by 2 ? No 2 4 1 3 Take ancestral graph of {1,2,4} 2 4 1 3 Moralize the graph 2 4 Are 1 and 4 separated by 2 ? No Dec-19 H.S. H.S. 11
U D A E C Estrogen and Endometrial cancer U=unknown uterine abnormality D=endometrial cancer E=estrogen C=vaginal bleeding A=ascertained cancer U D A E C Null hypothesis: E and D independent. Can we test H0? Case-control study, condition on A. Are E and D cond. independent given A? Does it help to adjust for C? 1. Take ancestral graph of {E,D,A} 2. Moralize 3. Separation by A? 4. Separation by C,A? No No Dec-19 H.S. H.S. 12
Test of H0 Can test H0 only if E and D are conditionally independent, given the variables we adjust for (C) C E D C E D Not OK OK Use tools to verify! Dec-19 H.S. H.S. 13
T C E E D D E D E D S Cause versus Association • Observe association, not necessarily causal: • Confounding • Reverse causation • Selection effect • Time trends Dec-19 H.S. H.S. 14
C E D C do(E) D Definitions • Association • Observing E predicts D • Causation • Manipulating E predicts D Dec-19 H.S. H.S. 15
Problem • Association ≠ causation • Intervention on association may be useless • Randomization not always feasible • Need causal information from observational studies Dec-19 H.S. H.S. 16
Mendelian randomization Dec-19 H.S. H.S. 17
Observational study all measured confounders adjusted for Randomized trial Strong effect, compliance Does not exist Does not exist RD if and only if E causes D Medelian randomization Gene/ exposure association strong, or large N Should not exist, Mendel’s 2. law Must not exist, depends on the function of the gene GD if and only if E causes D U E D Observation versus trial U 2 1 R E D 3 U 2 1 G E D 3 Dec-19 H.S. H.S. 18
Observational study Alcohol use increases blood pressure Many ”lifestyle” confounders Gene: ALDH2, 2 alleles 2,2 type suffer nausea, headache after alcohol low alcohol regardless of lifestyle (U) Medelian randomization Gene ALDH2 is highly associated with alcohol Mendel’s 2. law, no ass. to obs. confounders OK, gene function is known Result: 2,2 type BP +7.4 mmHg U A BP Ex: Alcohol and blood pressure U 2 1 G A BP 3 Dec-19 H.S. H.S. 19
U 2 1 G E D 3 Violations of core conditions • Gene/exposure association • Gene rare or weak effect large N • Compensation • and 3. Gene independent of U and D • Pleiotropy • Linkage disequilibrium • Population stratification H.S.