Download
1 / 33
330 likes | 339 Views
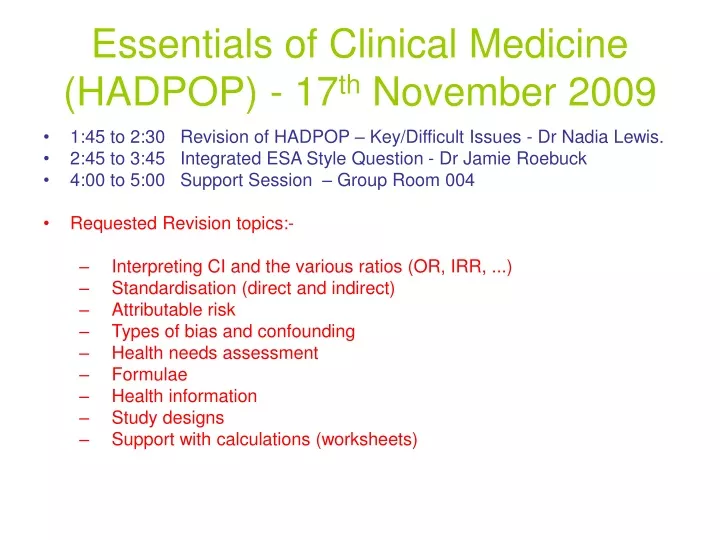
Essentials of Clinical Medicine (HADPOP) - 17 th November 2009. 1:45 to 2:30 Revision of HADPOP – Key/Difficult Issues - Dr Nadia Lewis. 2:45 to 3:45 Integrated ESA Style Question - Dr Jamie Roebuck 4:00 to 5:00 Support Session – Group Room 004 Requested Revision topics:-

E N D
Essentials of Clinical Medicine (HADPOP) - 17th November 2009 • 1:45 to 2:30 Revision of HADPOP – Key/Difficult Issues - Dr Nadia Lewis. • 2:45 to 3:45 Integrated ESA Style Question - Dr Jamie Roebuck • 4:00 to 5:00 Support Session – Group Room 004 • Requested Revision topics:- • Interpreting CI and the various ratios (OR, IRR, ...) • Standardisation (direct and indirect) • Attributable risk • Types of bias and confounding • Health needs assessment • Formulae • Health information • Study designs • Support with calculations (worksheets)
Measures of Relative Risk e.g. Incidence Rate Ratio (IRR) and Odds Ratio (OR)
Incident Rate Ratio • Measure of Relative Risk between 2 groups Incidence Rate in the Exposed Group = -------------------------------------------------- Incidence Rate in the Non-Exposed Group a/(a+b) = ---------------- c/(c+d) NB. Denominator for each rate in ratio is person-years
What is odds? • Odds of an event is: Probability that event happens = --------------------------------------------------- Probability event does not happen • For example we can consider the odds of exposure in cases and controls (diseased and non-diseased) in a case-control study • The odds ratio is the ratio of these 2 odds
Odds Ratio • Measure of Relative Risk between 2 groups • Interpretation not as intuitive as IRR • Approximately equal to IRR when disease is rare (rare disease assumption – we will see why…..) Odds of exposure in diseased group (cases) = --------------------------------------------------------------- Odds of exposure in non-diseased group (controls) = a/c ad ----------- = ------------ b/d bc • NB Can also calculate odds ratio as odds of disease in exposed group/ odds of disease in unexposed group (a/b ÷ c/d). Works out same as above approach
Rare disease assumption • When disease is rare a and c are small • Therefore: • a/(a+b) a (c+d) ad --------- = ---------- is approximately equal to --- c/(c+d) c (a+b) bc • Thus, IRR and OR are approximately the same when disease is rare
Standardised Mortality Ratios (SMRs) • A special case of relative risk. • Risk of death in your population compared to a reference population, which is adjusted for the effects of age (+/- sex) • O/E *100 • O = observed deaths in your population • E = expected deaths in your population if your population were to have the same death rates (in specific age groups) as the standard population • SMRs are the result of INDIRECT STANDARDISATION
Null Hypothesis (Ho) • Explicit statement of the hypothesis to be tested in the study. E.g. Case-control & Cohort studies • There is no relationship between exposure and disease • For case-control study:-OR = 1 • For cohort study:- IRR = 1, SMR = 100 RCTs • There is no difference between the changes in the experimental group with the new treatment and the changes with the standard treatment/placebo • Mean difference, incidence rate difference or risk difference between groups = 0
95% Confidence Intervals (CI) • 95% confident that the true value of a variable* is contained within the confidence interval. * i.e. a mean, proportion, rate, ratio • Lower 95% C Limit } Represent upper & • Upper 95% C Limit } lower boundaries of CI • Calculating CI (you will be given the formula for the Error Factor or the Error Factor itself):- Lower 95% CL = Observed value / Error Factor Upper 95% CL = Observed value X Error Factor • N.B. The above calculations apply to incidence rates, OR, IRR, SMR. Confidence interval calculations for means and proportions are different.
Interpreting 95% CI • If the 95% CI includes the ‘null hypothesis’ value, the data are consistent with no difference between the groups, and the result we got may well be due to chance • E.g. Mobile phone and glioma case control study • Ho :- Odds Ratio (OR) = 1 or no association between mobile phone use and glioma. • OR from study = 0.94 (95% CI 0.78 to 1.13) “The estimated odds ratio is 0.94 (best estimate), indicating that the odds of having glioma if you use a mobile phone is 0.94 times the odds of having glioma if you do not. We are 95% confident that the true OR would lie between 0.78 and 1.13. The confidence interval includes the null hypothesis (OR=1) Thus there is no evidence to reject the null hypothesis i.e. there is no association between mobile phone use and glioma. The results are not statistically significant (p>0.05).”
Interpreting 95% CI • If the 95% CI excludes the ‘null hypothesis’ value, the association or difference is unlikely to be simply due to chance • E.g. Sexual activity before 16 yrs and cervical cancer case control study from Week 6 • Ho :- Odds Ratio = 1 or no association between age of sexual activity and cervical cancer • OR from study = 3.99 (95% CI 1.88 to 8.46) “The estimated odds ratio is 3.99. (best estimate), indicating that the odds of having cervical cancer is 4 times higher in those who were sexually active before the age of 16. We are 95% confident that the true OR would lie between 1.88 and 8.46. The CI does not include the null hypothesis (OR=1). Thus we can reject the null hypothesis at the 5% level. There is a statistically significant association between age of sexual activity and cervical cancer (p<0.05).”
p values • Any results can be due to ‘chance’. • p values state how likely the results in the study would have occurred by chance if the null hypothesis was true. • E.g. p=0.04 – Under the null hypothesis, results as extreme or more extreme as this would occur completely by chance in 4 out of 100 studies. The results are unlikely to be due to chance, there is likely to be real difference/association, and designated ‘statistically significant’. • E.g. p=0.60 – Results as extreme or more extreme as this would occur by chance in 60 out of 100 studies. We cannot exclude the possibility that the results are due to chance, and are not statistically significant.
Relationship of p values to 95% CI • If 95% CI overlap with the null hypothesis, then p > 0.05, and the result is not statistically significant. • If the 95% CI do not include the null hypothesis, then p < 0.05, and the result is said to be ‘statistically significant’.
Incidence due to exposure Attributable Risk Background Risk Incidence not due to exposure Attributable Risk a conceptual model
Attributable risk • Attributable risk is a measure of absolute risk (2 measures): • Risk difference = risk in exposed – risk in unexposed group • Rate difference = incidence rate in exposed – incidence rate in non-exposed • Attributable risk gives us the incidence of disease in an exposed group which is attributable to that particular exposure. Attributable risk is an absolute measure, i.e. it can tell us actual numbers of people we are likely to help by preventing a particular exposure. • Attributable risk is important to know when taking action to prevent a disease
Attributable risk (%) • Incidence rate in exposed – Incidence rate in non- exposed ------------------------------------------------------------ Incidence rate in exposed • Attributable risk (%) gives us the proportion of disease in an exposed group which is attributable to that particular exposure • Attributable risk (%) is important to know when taking action to prevent a disease. However, attributable risk % is not an absolute measure (as it is a proportion) and, therefore, cannot tell us how many people we might help by preventing a particular exposure.
Comparison of Relative Risk and Attributable RiskExample: mortality rates for lung cancer and CHD Question: If smoking were eliminated, would the preventive impact be greater on mortality from lung cancer or from coronary heart disease?
Bias and Confounding • Bias = systematic error • 2 main types: selection (“wrong people”), information (“wrong information”) • Confounding = due to factor(s) associated with exposure, which also independently affect(s) disease risk.
What is Health Needs Assessment? ‘A systematic method of identifying unmet health and health care needs of a population and making changes to meet these unmet needs’ Wright and Kyle, in Pencheon 2006
Defining need Bradshaw, 1972: Felt need: need perceived by the individual Expressed need: felt need that is expressed Normative need: defined by a professional Comparative need: need implied by an inequitable service to comparable populations Matthew: Need as defined by population’s capacity to benefit from health care interventions
Health Needs Assessment • Comparative – comparing levels of service and health need between different populations • Corporate - collection of the knowledge and views of interested parties on health care services and needs • Epidemiological: • Size of the problem? (epidemiology) • Current services • What works? (evidence base) Stevens and Raftery, 1994
Formulae – What will you need to know • Need to know how to calculate incidence, prevalence etc. • Need to know how to perform all relative risk calculations, SMRs • Need to know how to calculate 95% CI when given the formula for the error factor or the error factor itself.
Health Information – Important Sources • Mortality data • Quality and Outcomes Framework • Hospital Episode Statistics • Health Survey for England • Notifications of communicable disease • Census http://www.healthknowledge.org.uk/parta/paper1knowledge/3_healthinformation http://www.healthknowledge.org.uk/parta/paper1knowledge/1_researchmethods/1a_Epidemiology
THANK YOU! • These slides were put together with thanks to Wendy Robertson and Professor Francesco Cappuccio. • Please return to the lecture theatre for 2:45pm and feel free to join us for the practical session 4 – 5pm in Group Room 004. • Nadia.J.Lewis@warwick.ac.uk