Download
1 / 37
370 likes | 390 Views
Evon Hekkala NERL Postdoctoral Fellow EPA Region 5 Chicago, IL 28 April 2005. Molecular Markers for Ecological Indicators. Genetic Methodologies to improve existing Ecological Indicators for Aquatic Ecosystems.

E N D
Evon Hekkala NERL Postdoctoral Fellow EPA Region 5 Chicago, IL 28 April 2005 Molecular Markers for Ecological Indicators
Genetic Methodologies to improve existing Ecological Indicators for Aquatic Ecosystems • development of accurate and precise methods for biological identification of aquatic species and subspecies • delineation of ecological assessment units through analysis of genetic structure across multiple species • assessment of changes in genetic diversity as an indicator of present and historical environmental condition • assessment of genetic diversity at diagnostic loci and across the genome as an indicator of vulnerability to future environmental perturbations • integrated assessments to link landscape-level stressors to population-level outcomes
Ecosystem Species Genes Biodiversity • Genetic diversity is a fundamental component of biodiversity • Stressors affect genetic diversity in predictable ways (ecological indicator) • Genetic diversity limits potential responses to future stressors (sustainability indicator) • Understanding of genetic diversity patterns enhances the value and interpretation of other ecological assessment data
IMPROVED METHODS FOR SPECIES IDENTIFICATION AND ENUMERATION RELEVANCE: • Understanding of ecological condition depends on accurate description of species assemblages • DNA provides the most accurate and precise information on species identity • EPA needs efficient and transferable “DNA ID” or “DNA barcoding” methods
DELINEATION OF ECOLOGICAL ASSESSMENT UNITS RELEVANCE: • Measurement and evaluation of ecological condition must be performed at the correct environmental scale • Many assessments incorporate the watershed or ecoregion as the fundamental assessment unit • For biological resources, the fundamental unit that responds to and adapts to the environment is the biological population
CHANGE IN GENETIC DIVERSITY AS AN INDICATOR OF ECOLOGICAL CONDITION RELEVANCE: • Environmental stressors that alter the genetics of populations have lasting effects • Genetic change is brought about by environmental alterations that affect the breeding population size, mutation rate, population connectivity, or selective forces • Genetic change is an indicator of population and species-level effects, scales at which we have few good indicators
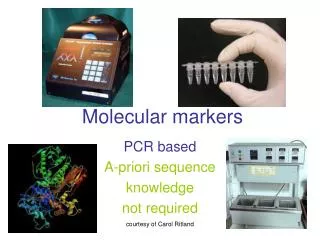
How?Collect SamplesExtract DNAAmplify Sections of DNAAFLP/RAPDMicrosatellitesSequencingAnalyze Data
Sample Collection and Extraction • DNA is everywhere! • Traditional vouchering • Non-invasive, non-destructive • Fin Clips, scales, swabs, feces, hair, shed antlers, egg shells, scrimshaw…… • Museum Collections ( wet/dry)
AFLP AmplifiedFragment LengthPolymorphism
Much more repeatable More polymorphisms Dominant (presence/absence), anonymous markers Amenable to automation AFLP
TATATATATATA TATATATATATATATA TATATATATA TATATATATATATATATA Microsatellites • Highly polymorphic (high mutation rates) • Well-characterized, codominant single-locus markers • Highly amenable to automation
Microsatellites Locus 1 Locus 2
DNA sequences • Intensive analysis of one locus (COI, Cytochrome B) • Most explicit genetic ID available • More costly, but allows different types of analyses
Characterization and Identification of species diversity Arthropoda Sp. A Chordata Sp.B Cytochrome Oxidase I mitochondrial gene sequences from GenBank provides a large framework for assignment of experimental data to gross taxonomic groups Sp.C Mollusca (redrawn from Hebert et al. 2003)
PCR primers for amplification of targeted species • Requires identification of primer binding sites that are: • identical among individuals within a target group • absent or ineffective among members of excluded group Requires identification of gene regions that are: consistent within the target group variable among members of different target groups
Current Projects- NERL/ORD • Regional profile of fish genetic diversity in Eastern Cornbelt Plains Ecoregion (Region 5 REMAP) • Genetic diversity of stream fish in a coal mining-impacted region. • Regional profile of fish genetic diversity in Mid-Atlantic Integrated Assessment (EMAP) area • Temporal trends in genetic diversity in relation to experimental whole-lake acidification (collaboration with DFO-Canada) • Temporal and spatial patterns of fish genetic diversity in a highly modified urban stream • Integrated ecological assessments using genetic, landscape, and population modeling methods (cross-NERL/ORD collaboration) • Development of rapid Genetic ID methods to enhance detection and enumeration of benthic invertebrates
Genetics of Central Stonerollers in The Eastern Cornbelt Plains Ecoregion Campostoma anomalum Photo courtesy of Ohio Dept. Natural Resources
Goals • Define meaningful population units for ecological assessments • Assess relationship between genetic diversity and ecological condition
Study Sites • 91 sample sites • Part of Regional EMAP • Mostly agricultural • First-third order streams Genetic Analysis • RAPD fingerprints • mtDNA Sequences • Assess genetic • differences within/ • among sites
Genetic Relatedness Among sites
Genetics of Creek Chubs in a Mining-Impacted Region Semotilus atromaculatus Photo courtesy of Ohio Dept. Natural Resources
Mitochondrial DNA Population genetic structure
Stepwise multiple regression – nuclear DNA diversity 98% of the differences in genetic diversity within populations explained by geographic and environmental factors!
Regional profile of fish genetic diversity in Mid-Atlantic Integrated Assessment (EMAP) area White SuckerCatostomus commersoni • How is Diversity distributed? • How accurate is Morphological ID in the field? • How do we identify Hybrids? • How do IDs affect IBIs?
99 DNA Taxonomic Identification Semotilus atromaculatus Group 1 (303 sequences plus Genbank reference sequence) 97 100 99 Semotilus atromaculatus Group 2 (34 sequences) 100 Semotilus corporalis (11 sequences) Sample 9576 100 Rhinichthys atratulus Notropis stilbius Notropis girardi 97 Luxilus cornutus 50 Sample 3786 100 Luxilus chrysocephalus 85 0.10 0.08 0.06 0.04 0.02 0.00 Linear sequence divergence
How accurate is field identification of stream fishes? • 96% of white suckers were morphologically identified correctly • All creek chub were morphologically identified correctly, but the taxon is composed of two morphologically similar but genetically distinct groups in the MAIA region • A minimum of 85% of fallfish were morphologically identified correctly • All central stonerollers were morphologically identified correctly, but the taxon is composed of four morphologically similar but genetically distinct groups in the MAIA region • Field morphological identification seemed to be reasonably accurate for these taxa but morphological identification under-represented the actual biological diversity uncovered • Morphological analysis supplemented with genetic identification is recommended for future ecological assessments ie. DNA QA
100 Group1 (47sequences) 78 100 100 Group 2 (16 sequences) 100 Group 3 (11 sequences) 85 100 Group 4 (8 sequences) Outgroup (S. atromaculatus) 0.10 0.08 0.06 0.04 0.02 0.00 Linear sequence divergence • Multi-species assessment of fish genetic diversity in the MAIA region • Microsatellite diversity of white sucker was strongly associated with agricultural impacts and human population density. • Creek chub diversity was associated with stream substrate condition and geochemistry. • Central stoneroller diversity was associated with agriculture, human population density, runoff, pH, stream substrate and geochemistry. • Different species and genetic groups within recognized species appeared to respond to different environmental dimensions.
Targeted screening for invasive species in ballast: genomic approaches
Who are the Culprits? European green crab Where do they come from? Zebra mussels
Daphnia sp. Bosmina sp. ?? European green crab Zebra mussel Polychaete
Identifying species found in ballast Traditional: Morphological taxonomy • technologically simple (ie. microscopy…) • classification dependent on adult traits • larval and egg forms poorly characterized • requires broad knowledge of major taxonomic groups • or requires assistance from a range of experts • identification typically limited to family or genus level • limited treatment of cryptic or difficult taxa • no standard for comparison across studies • data have limited applicability (ie. species inventories…)
DNA extraction and purification Resting eggs or tissue in ballast water or sediment www.glerl.noa.gov/res/task._rpts/nsreid10-1.html “from sludge to sequences” Sequencing of cloned amplicons Allele-specific PCR amplification Bacterial cloning of amplicons
Collaboration • Research supported by the Regional Methods program • ORD partnering with Regions 5, 9, 10 and GLNPO • Novel application of allele-specific PCR methods and DNA sequencing technology • Development and application of bioinformatic databases • Research objectives: • Exploratory characterization of species diversity in ballast • Targeted screening of ballast for invasive species
Regional Implementation Marker Development Laboratory Regional Laboratory • Develop and test microsatellites, other markers • Design Assessment • Field Sampling • DNA extraction • (PCR) Ecological interpretation • (PCR) • Marker screening • Genetic Diversity assessment Genetic Analysis Laboratory