Download
1 / 6
60 likes | 152 Views
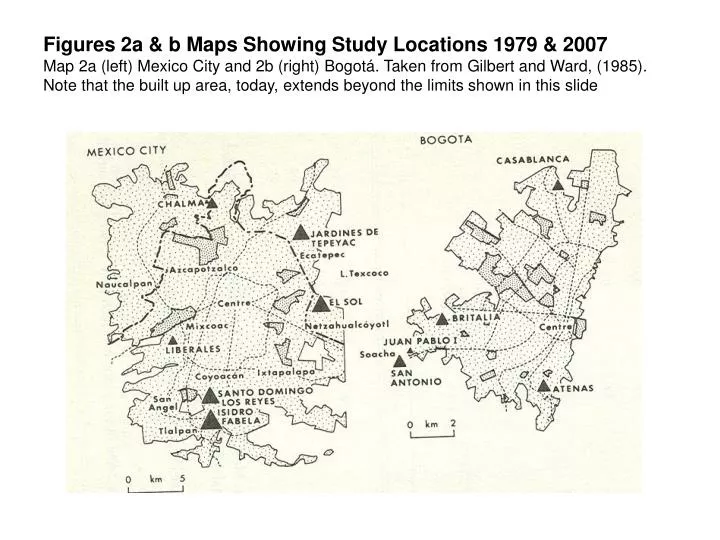
Figures 2a & b Maps Showing Study Locations 1979 & 2007 Map 2a (left) Mexico City and 2b (right) Bogotá. Taken from Gilbert and Ward, (1985). Note that the built up area, today, extends beyond the limits shown in this slide.

E N D
Figures 2a & b Maps Showing Study Locations 1979 & 2007Map 2a (left) Mexico City and 2b (right) Bogotá. Taken from Gilbert and Ward, (1985). Note that the built up area, today, extends beyond the limits shown in this slide
Figures 1a (left) and 1b (right). 1973 photos of Mexico City former squatter settlement Isidro Fabela looking north towards outer ring highway (behind 3 story dwelling). In Fig.1b the small corner store is now (2007) a small café/restaurant.
Figures 1c & 1d. 2007 views of the same consolidated settlements, Colonia Isidro Fabela, Mexico City. Figure 1c shows the same 3 story dwelling (from Figs. 1a & 1b) in close up. Figure 1d shows how lots may be divided (between 2 kin related families [note double electricity meters on the left hand home]); while part of next door’s lot has been sold off as a separate dwelling (garage door & entrance with rooms above).
Mexico City - Santo Domingo 1973 1980