Download
1 / 13
130 likes | 255 Views
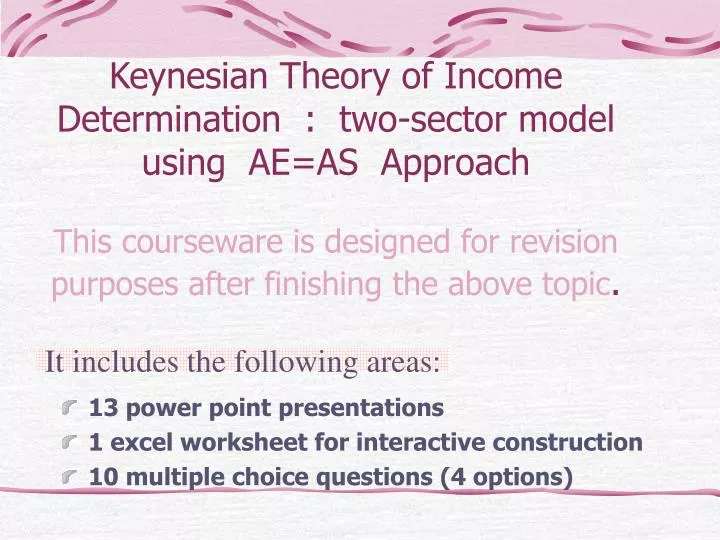
Keynesian Theory of Income Determination : two-sector model using AE=AS Approach This courseware is designed for revision purposes after finishing the above topic. 13 power point presentations 1 excel worksheet for interactive construction 10 multiple choice questions (4 options).

E N D
Keynesian Theory of Income Determination : two-sector model using AE=AS ApproachThis courseware is designed for revision purposes after finishing the above topic. • 13 power point presentations • 1 excel worksheet for interactive construction • 10 multiple choice questions (4 options) It includes the following areas:
Keynesian Theory of Income Determination : two-sector model using AE = AS Approach Coursework(Sec1-39-11) by s.w. Leung
Assumptions in NI Models • a single concept of NI (Y) • a constant level of potential income (Yf) • existence of unemployment • constant price level i.e. Y=Q since P=1
Two-sector model --- Keynesian • Circular flow diagram • E(AE) : Aggregate expenditure • Y(NI) : National income Next section
Circular flow diagram C National Income Household National Expenditure S Financial market C : consumption I S :saving Two sectors : Household & Firm I :investment Y :Income generated E :Payments for goods & services Y Firm E
E (AE) :Aggregate expenditure In a two-sector economy, firms (F) produce consumption goods (C) and investment goods (I) , that means expenditure (E) in the economy is on either C or I ; and we get an income-generated function. E = C + I
Y(NI) : National income On the other hand, income (Y) received by households (H) is either consumed (C) or saved (S). To complete the flow of income and expenditure, E = Y, we get the equilibrium income (Ye).
A graphical approach (AE = AS) to income determination • E function and Y-line • component of AE • simple algebra of income determination • construction
E function and Y-line E E function E(AE) : Demand side E=C+I E = C + I Y(AS) : Supply side 0 Y E Y-line(450) E = Y Construct a Y-line (450) : shows all the points where E equals Y 0 Y E = Y = Q (re: assumption P=1) (E) expenditure in the economy equals (Y) income generated by producing (Q) output
Component of AE Consumption function : Cf Cf = C + cY a function of Yd (in a two-sector model Y = Yd) C : intercept on E-axis (amount consumed when income is zero) c : slope of Cf (c is the marginal propensity to consume) Investment function : I I : an autonomous function (doesn’t vary with Y) Aggregate expenditure function (E or AE) E = C + I a function of Y
Simple algebra of income determination Solution : E = C + I E = 80 + 0.6Y + 40 = 120 + 0.6Y In equilibrium E = Y(Ye) Y = 120 + 0.6Y 0.4Y = 120 Y = 300 and C = 80 + 0.6(300) = 260 Given : C = 80 + 0.6Y I = 40 Find Ye
construction Let’s take C = 80 + 0.6Y and I = 40 to find Ye graphically An excel worksheet (sheet 1) will be used to illustrate. next
Multiple Choice ExerciseMCdemo25.htmdemo1.wmf You come to the END !!!