Download
1 / 67
670 likes | 767 Views
Mortality Risk Valuation for Air Quality Policy. Alan Krupnick, PhD Senior Fellow and Division Director Resources for the Future NERAM V, October 17, 2006. Value of v Life. Statistical The “value of life” is a religious/ethical concept – not economics

E N D
Mortality Risk Valuation for Air Quality Policy Alan Krupnick, PhD Senior Fellow and Division Director Resources for the Future NERAM V, October 17, 2006
Value of v Life Statistical • The “value of life” is a religious/ethical concept – not economics • The value of statistical life is an expression of preferences for reducing risks of death (in monetary terms)
Value of Statistical Life • VSL = The willingness to pay for mortality risk reduction / risk reduction • VSL = $100/(1/10,000) = $1 million • # deaths averted * VSL = mortality benefits EPA’s VSL = $6 million (2000$)
Policy Context • Government regulations are often very costly to society and deliver benefits of very different types and quantities • So need a way of identifying those that deliver the greatest bang (buck) for the buck, i.e., are efficient • Other factors matter at least as much: equity, legality, political
Cost-Benefit Analysis is… A technique for comparing the utility to society of the benefits of an action against the cost to society of that action. The preferences of people for both the benefits and the “costs” are expressed in monetary terms.
Many major applications of benefit-cost analysis (BCA) • Social cost of Electricity (e.g., U.S., Europe (EXTERNE)) • Japanese role • EXTERNE: Social cost of Transportation, CAFÉ • U.S.: BENMAP, OMB and EPA guidance • Chinese: ECM (World Bank) • U.S. Regulatory Impact Analyses of regulations
How to measure these preferences • Add up savings to economy • Cost-of-illness (medical costs, productivity loss), human capital approach Willingness to pay (WTP) approaches: • Observe choices – revealed preferences • Hedonic price methods: wage-risk trade-off. • Asks people questions -- stated preferences • Contingent valuation, Conjoint analysis
Problems with Revealed Preference (Labor Market Studies) applied in air pollution context • Accidental not cardiopulmonary deaths • Relatively healthy and young population, not older unhealthy population • Lots of unobserved reasons for wage differentials
Example of Stated Preference Survey • Co-principles: Alan Krupnick, Maureen Cropper, Anna Alberini, Nathalie Simon • Funding from USEPA, Health Canada, MITI • Implemented in U.S., Canada, Japan, UK, France, Italy and Korea. China almost done • Publications: Journal of Risk and Uncertainty, 2002; JEEM, 2004. Others planned
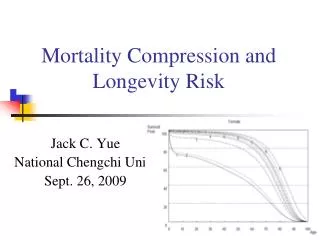
Percentage of Yes responses by bid -Japan Percentage of “Yes” Responses to the Initial Payment Questions
Key Findings • Results are credible. Pass external scope test and internal validity tests • VSL for current risk change is 3-10X smaller than the “standard” value of $6 million. • Age and mental and physical health status matter
Mean VSL By Country and Study ($US Figures obtained with PPP Conversions)
Conceptual Foundation • Economics: Consumer sovereignty as a social goal Capturing individual preferences • For private risk reduction • For public risk reduction
For Private Risk Reduction Life Cycle Model (effect of age on WTP) • Older people • have fewer years left (-) • view life years left as more precious (+) • are in worse health • You have to pay me to live longer! Complementarity of health with consumption (-) • Especially sensitive to approaching mortality (+) It’s an empirical question
For Public Risk Reduction • Most individuals (even the elderly) WTP more to save younger people’s lives than older people’s lives.
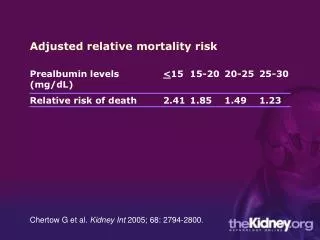
EPA’s Departure from Its Standard Practice • Its 2003 Regulatory Impact Analysis (cost-benefit analysis) for “Clear Skies:” • EPA made a distinction between the monetary value of reducing mortality risk to the elderly (over 70) and to other adults • Specifically, $3.8 million per “statistical life saved” for the elderly and $6 million for others • In supplementary analysis: ~$275,000 per life year saved * # life years saved VSLY approach
The Backlash • “Our parents and grandparents built America into the strongest nation on earth; they are not worth just two-thirds of us.” Representative Tom Allen (D.Maine) • “EPA will not -- repeat not -- use an age adjusted analysis for decision making with Clear Skies or any other program or regulatory effort.” Christine Todd Whitman, EPA Administrator
Waxman/Allen Amendment: SEC.418. None of the funds provided in the Act may be expended to apply, in a numerical estimate of the benefits of an agency action, monetary values for adult premature mortality that differ based on the age of the adult.
The Current Situation • Other countries doing age-adjustments: • Canada (VSL 25% lower > 65) • EU (VSL declines with age) • EPA swore off the senior discount. • But, some at EPA again proposing “prime-time” use of value of a statistical life year (VSLY)
Summing up • Findings are messy, but it is clear that based on preferences, VSL could be constant for all or lower for elderly. • But preferences don’t change proportionally to life-expectancy, so don’t use VSLY • We shouldn’t expect, nor use one VSL for all situations, including age, income, gender, race, public goods vs. private goods, cause • But efficiency isn’t everything and as a society we can make choices to act as if one size fits “all” or to override efficiency
Table 4. Summary of Clear Skies Initiative Benefits Based on USEPA VSLs and VSLs
Key Issues • Whose preferences matter? • The elderly themselves? • Utilitarianism: Let view of individuals matter • Society in general? (and what does this mean?) • Rawls’ Veil of Ignorance: preferences if you did not know your state • The “commodity” to be valued • Private good (benefit enjoyed exclusively by individual) • Public good (benefit enjoyed by public)
VSL vs. VSLY • “One size fits all” VSL treats elderly the same as others • VSLs that vary by age from literature that finds “discounts” for elderly • VSLY assumes “discounts” for the elderly proportional to life expectancy
Goals for the Krupnick et al Survey Program • Estimate annual individual WTP over next ten years for private risk reductions of: • 5/1000 over the next ten years, • 1/1000 over the next ten years, • 5/1000 starting at 70, over the following ten years • For people over 39 (one-third over 60) • For people in all states of physical and mental health
Features • Developed from focus groups/one-on-ones • Extensive risk communication and testing • In-person on computer self-administered, 30 minutes or over internet (WEB-TV) • Extensive visual, auditory aids and simple keypad • Abstract risk reduction method, payment vehicle • Double-bounded dichotomous choice to elicit bid
Survey Outline • Basic demographics and health background • Examples and exercises in interpreting risks • Examples of averting behaviors and their risk reductions WTP questions • Each respondent gets three WTP questions (or two if over 65): contemporaneous then latent • Debriefing questions and more demographics
Survey Outline • Basic demographics and health background • Examples and exercises in interpreting risks • Examples of averting behaviors and their risk reductions WTP questions • Each respondent gets three WTP questions (or two if over 65): contemporaneous then latent • Debriefing questions and more demographics
Basic Structure of WTP Questions External Scope test
Government support for pollution-related policy research • US EPA budgets for epidemiology and monetary valuation • Support for CAFÉ in Europe • China and the ECM effort by World Bank • Current support by METI
EPA’s Traditional Use of the VSL • One VSL (currently ~$6 million) • Its 2003 Regulatory Impact Analysis (cost-benefit analysis) for “Clear Skies:” • EPA made a distinction between the monetary value of reducing mortality risk to the elderly (over 70) and to other adults • Specifically, $3.8 million per “statistical life saved” for the elderly and $6 million for others • In supplementary analysis: ~$250,000 per life year saved * # life years saved VSLY approach
Role for Benefit-Cost Analysis (BCA) in Regulatory Decisions • Benefits exceed costs (Reagan Administration) • Benefits justify the costs (Clinton Administration) • Benefits and costs are to be considered (Superfund site remediation) • Benefits can be considered but costs cannot (National Ambient Air Quality Standards under U.S. Clean Air Act) BCA a tool not a rule
Externalities • Externalities arise when economic activity affects third parties who have no influence on the activity=>market or government failure • Not all third party effects are externalities: e.g. damages to property during a car accident.
BCA Strengths • Accounting framework (array advantages and disadvantages) • Transparency • Comprehensiveness • Ignorance revelation and uncertainty • Accountability • Comparability • Normative – provides a “stopping rule” • Based on preference satisfaction and aggregation of individual changes in well-being into benefits and costs
Real Limitations • Equity not taken into account • Lack of comprehensiveness • Difficult in practice
Experience with BCA in Regulatory Design(Morgenstern, 1997) • All Regulatory BCA’s studied “ended up improving the rules;” attribution to the BCA itself is difficult • Guided development of rules • Added/eliminated/adjusted alternatives • Supported decisions • Wide range of quality