Download
1 / 21
220 likes | 364 Views
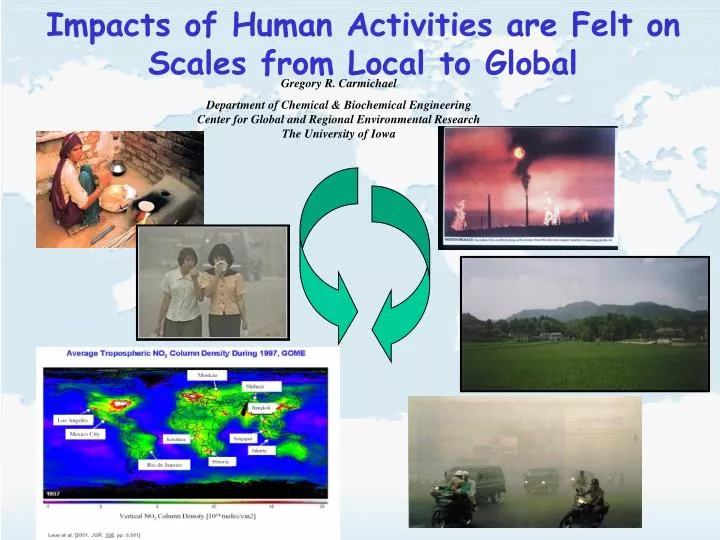
Impacts of Human Activities are Felt on Scales from Local to Global. Gregory R. Carmichael Department of Chemical & Biochemical Engineering Center for Global and Regional Environmental Research The University of Iowa.

E N D
Impacts of Human Activities are Felt on Scales from Local to Global Gregory R. Carmichael Department of Chemical & Biochemical Engineering Center for Global and Regional Environmental ResearchThe University of Iowa
Urbanization a Driver of Environmental Change • Megacities account for a significant fraction of GNP (In Asia, 10 largest cities account for ~40%) • Indoor and Outdoor air pollution pose severe human health concerns • Each 1 million urban inhabitants emit average of 25,000 tons of CO2 every day (six times global per capita average)
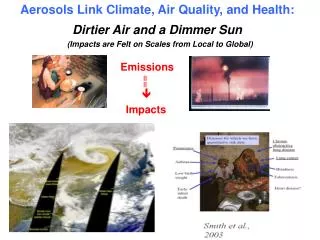
Aerosols Link Air Quality, Health and Climate:Dirtier Air and a Dimmer Sun Anderson et al., Science 2003 Smith et al., 2003 He et al., 2002
Improving Predictability of Air Quality (analysis and forecasting perspectives) ? Modeled Observed
Air Quality Modeling: A Key Component of Air Quality Analysis Met model Optimal analysis state Chemical, Aerosol, Removal modules CTM Observations Data Analysis & Assimilation Forecast Emissions Air Quality &Flight Planning
Predictability – as Measured by Correlation Coefficient Met Parameters are Best < 1km O3 predicted “better” than CO Performance decreases with altitude Carmichael et al., JGR, 2003
How Good Are Current Air Quality Models? Model-1 Model-2 Model-3 Model-4 MICS Phase II Results Model-5 Model-6 Model-7 Model-8 Sulfate concentration in March 2001 (mg m-3) http://www.adorc.gr.jp/adorc/mics.html contents
Forecasting Air Quality an Important Activity in Air Quality Management *Persistence * Single Forward Model w/o assimilation * Ensemble forecast (8 models) w/o assimilation McKeen et al., JGR, 2005
A More Formal Integration of Measurements & Models: 4dVar • Cost functional: measures the model-observation gap. • Goal: produce an optimal state of the atmosphere using: • Model information consistent with physics/chemistry represented • Measurement information consistent with reality Within errors !!!!!! • 4dVar: minimize the differences between model and observations by adjusting certain model parameters Data: Larc
Assimilation of AIRNOW O3 surface observations for July 20, 2004 Observations: circles, color coded by O3 mixing ratio Surface O3 (forecast) Surface O3 (analysis)
Vertical Distributions of Ozone in the Mid and Upper Troposphere Remain Poorly Constrained Sensitivity of predicted profiles wrt to global model boundary conditions all DC-8 Flights Assimilation of O3-sonde data before after IONS O3 data: Anne Thompson & John Merrill
Significant impact of ozone forecasts when using background covariance Observation error 8%; Initial ozone is control; only ozone assimilated
Emissions are Highly Uncertain where, j,k,l,m,n = species, region, sector, fuel/activity type, abatement technology; E = emissions; A = activity rate; ef = unabated emission factor; η = removal efficiency of abatement technology n; α = maximum application rate of abatement technology n; and X = actual application rate of abatement technology n.
Improving Emissions using Observations –Inversions (ad hoc formal)
CO emission adjustment by 4D-Var Observations: WP3 CO measurements on Aug. 6, 2004
Megacities: A Key Part of the Solution • Megacities feel the change first & have the $ & power to act • Health impacts are a primary measure; urban centers will react to policy measures faster than a province or a region
Elements of Regional Air Quality Management • Models are a key element of AQ management. • Models have improved substantially. • Improvements will require reductions in key uncertainties (e.g., emissions) and closer integration of observations. • Need for multiple approaches and intercomparisons.