Download
1 / 36
360 likes | 364 Views
Interactive C-cycle in Earth System models. Helge Drange helge.drange@gfi.uib.no. Most of the effort. Mean change vs uncertainty. IPCC (2007). Most of the impact. Most of the effort. Mean change vs uncertainty. Goal: Improve knowledge and by that better quantify and, over time,

E N D
Interactive C-cycle in Earth System models Helge Drangehelge.drange@gfi.uib.no
Most of the effort Mean change vs uncertainty IPCC (2007)
Most of the impact Most of the effort Mean change vs uncertainty Goal: Improve knowledge and by that better quantify and, over time, reduce uncertainty IPCC (2007)
Ex: Long lived GHG warming vs aerosol cooling IPCC (2007)
Ex: Long lived GHG warming vs aerosol cooling IPCC (2007)
Ex: Long lived GHG warming vs aerosol cooling IPCC (2007)
Ex: Long lived GHG warming vs aerosol cooling How and what if? Uncertainty about magnitude (not sign) of radiative forcing IPCC (2007)
Size and stability of Earth’s carbon reservoirs Reference numbers (ca) (i) Human induced emissions of CO2 per year: 10 Gt-C (ii) Human generated emissions of carbon, 1850-2010: 300 Gt-C (iii) Fossil reserves: 5000 Gt-C
Very likely Uncomfortable zone Likely Unlikely Highly unlikely 100 Gt-C 10 1000 Gruber et al. (2004)
Land Soil carbon Very likely Terrestrial biomass Likely Wetlands and peatlands Unlikely Permafrost Highly unlikely 100 Gt-C 10 1000 Gruber et al. (2004)
Land Soil carbon Very likely Terrestrial biomass Likely Wetlands and peatlands Unlikely Permafrost Highly unlikely Stability being discussed 100 Gt-C 10 1000 Gruber et al. (2004)
Ocean Solubility pump Very likely Soft tissue pump Likely Carbonate pump Unlikely Methane hydrates Highly unlikely 100 Gt-C 10 1000 Gruber et al. (2004)
Ocean Solubility pump Very likely Soft tissue pump Likely Carbonate pump Unlikely Methane hydrates Highly unlikely Lack of knowledge 100 Gt-C 10 1000 Gruber et al. (2004)
Size and stability of Earth’s carbon reservoirs Summary: Large reservoirs of carbon are found on land and in the ocean. These reservoirs have the potential to greatly influence Earths climate (pending on time scale and degree/speed of warming)
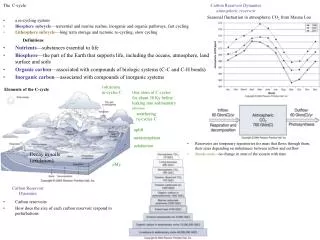
Climate projectionsTraditional approach Off-line scenarios from population, energy, economics models EMISSIONS CONCENTRATIONS CO2, methane, etc. Off-line carbon cycle and chemistry models HEATING EFFECT ‘Climate Forcing’ Coupled climate models CLIMATE CHANGE Temp, rain, sea-level, etc. Off-line impacts models IMPACTS Flooding, food supply, etc.
Climate projectionsBiogeochemical feedbacks included Off-line scenarios from population, energy, economics models EMISSIONS CONCENTRATIONS CO2, methane, etc. Off-line carbon cycle and chemistry models HEATING EFFECT ‘Climate Forcing’ Coupled climate models CLIMATE CHANGE Temp, rain, sea-level, etc. Off-line impacts models IMPACTS Flooding, food supply, etc.
Climate projectionsEarth System Model Off-line scenarios from population, energy, economics models EMISSIONS Earth System Model CONCENTRATIONS CO2, methane, etc. Standard for the IPCC AR5 (due 2013/14) HEATING EFFECT ‘Climate Forcing’ CLIMATE CHANGE Temp, rain, sea-level, etc. (future ?) Off-line impacts models IMPACTS Flooding, food supply, etc.
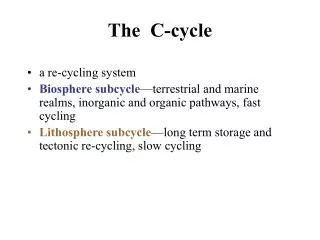
Biogeochemical processes on land Arneth et al., Nature Geosci.(2010)
Biogeochemical processes on land Arneth et al., Nature Geosci.(2010)
Biogeochemical processes on land Arneth et al., Nature Geosci.(2010)
Biogeochemical processes on land Tropospheric O3 NPP Arneth et al., Nature Geosci.(2010)
Biogeochemical processes on land Soil NOx +BVOC O3 formation & CH4 lifetime Arneth et al., Nature Geosci.(2010)
Biogeochemical processes on land Similar for the ocean. Key challenge: To identify and understand zero-order processes (on the spatial and temporal scale of interest) BVOC Biogenic secondary aerosols Arneth et al., Nature Geosci.(2010)
Standard SRES A2 (IPCC AR4) Enhanced warming with interactive carbon cycle? • w/interactive CO2 Friedlingstein et al. (2006)
Standard SRES A2 (IPCC AR4) Standard SRES A2 (IPCC AR4) Enhanced warming with interactive carbon cycle? • w/interactive CO2 Tendency for more CO2 remaining in the atmosphere, and for additional warming • w/interactive CO2 Friedlingstein et al. (2006)
CO2 flux from ocean to atmosphere (from EU project ENSEMBLES) 6 Hadley INGV IPSL Bjerknes MPI Model mean 4 2 Gt-C / yr 0 -2 -4 -6 1850 1900 1950 2000 2050 2100 Johns et al., Clim. Dynamics (2011)
CO2 flux from ocean to atmosphere (from EU project ENSEMBLES) 6 Reduced ocean uptake of CO2 is mainly caused by increased temperature in the ocean surface waters Reduced CO2 solubility Enhanced stratification and reduced vertical mixing Partly also reduced biological production Hadley INGV IPSL BCCR MPI Model mean 4 2 Gt-C / yr 0 -2 -4 -6 1850 1900 1950 2000 2050 2100 Johns et al., Clim. Dynamics (2011)
CO2 flux from land to atmosphere (from EU project ENSEMBLES) 6 Hadley INGV IPSL Bjerknes MPI Model mean 4 2 Gt-C / yr 0 -2 -4 -6 1850 1900 1950 2000 2050 2100 Johns et al., Clim. Dynamics (2011)
SP550 SP1000 Permissible emissions with interactive CO2 Stabilization at SP550 requires a cumulative 24% reduction of permissible emissions due to positive carbon cycle feedback (23% for SP1000) MIROC integrated Earth System Model (Kawamiya et al.)
Ocean acidification (and timescales involved) Ω (saturation state of calcite) Ilyina & Zeebe (2012)
Short-term confusion & long-term gain (or academic learning phase vs practical applicability)
Increased complexity will, generally, lead to (an apparent) growth in model uncertainty, but overall improvement over time Simulated quantity Communication challenge! Uncertainty Observed (true) value Time 2012 AOGCM ESM
A few practical and pragmatical marks Projections, commitments, long-term changes and irreversibility… calls for ESMs Model verification Common experience that dynamic biogeochemisty in AOGCMs uncover weaknesses in the model's physics, dynamics and/or numerics Model evaluation Availability of relevant observations in stead of lot's of “tuning” parameters Interdisciplinarity Math/phys based sciences + biology/chemistry/geology/social sci’s Model compexity vs Model resolution, long integrations, ensemble integrations Model diversity Few very complex and interacting models vs many simplified models Model spin-up Physical vs biogeochemical model ✔ ✔ ! ! ! obs obs