Download
1 / 14
140 likes | 301 Views
Linear Transformations 2.1b . Learning Target: Transform linear data and determine its effect on center and spread. HW: pg 107: #19-24.

E N D
Linear Transformations2.1b Learning Target: Transform linear data and determine its effect on center and spread. HW: pg 107: #19-24
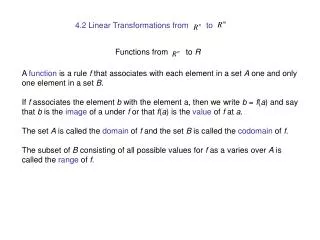
To find the standardized z-score for an individual observation, we transform this data value by subtracting the mean and dividing by the standard deviation. This transformation converts the observation from the original units of measurement to a standardized scale.
But what about other linear transformations – like adding, subtracting, multiplying, or dividing? How would it affect the shape, center, and spread of the entire distribution?
Describe the distribution: • Shape: bimodal with peaks at 10 and 15 Skewed right • Outliers: 17+1.5(6)=26 11-1.5(6)=2 outliers at 27, 35, 38, 40 • Center: Median is 15 • Spread: range is 8-40. IQR=6
The actual width of the room was 13 meters wide. The student who guessed 8 meters was too low by 5 meters, and the student who guessed 40 meters was too high by 27 meters. We can examine the distribution of students’ guessing errors by defining a new variable as: error = guess – 13. That is, we will subtract 13 from each observation in the data set. What do you predict will be the shape, center, and spread of this new distribution?
Shape: Stays the same • Outliers: Subtract 13 from each • Center: Median – 13 • Spread: range does not change
Effect of Linear Transformation Adding or subtracting the same number, a, (either positive, zero, or negative) to each observation: • Adds a to measure of center and location (mean, median, quartiles, percentiles) • Does not change shape or measures of spread (range, IQR, standard deviation)
Multiplying or dividing each observation by the same number, b, (positive, negative, or zero) • Mult or div measures of center and location (mean, median, quartiles, percentiles) of b. • Mult or div measures of spread (range, IQR, standard deviation) by absolute value of b. • Does not change shape.
Example: Cockroaches • Maria measures the lengths of 5 cockroaches that she finds at school. Here are her results (in inches): 1.4 2.2 1.1 1.6 1.2 • Find the mean and standard deviation of Maria’s measurements. (use calc)
Example: Cockroaches • Maria’s science teacher is furious to discover that she has measured the cockroach lengths in inches rather than centimeters (There are 2.54 cm in 1 inch). She gives Maria two minutes to report the mean and standard deviation of the 5 cockroaches in centimeters. Maria succeeded. Will you? xnew = a + bx
To obtain mean and s in centimeters, multiply the results in inches by 2.54: New Mean = 1.5 x2.54 = 3.81cm New s = .436 x 2.54 = 1.107 cm
c. Considering the 5 cockroaches that Maria found as a small sample from the population of all cockroaches at her school, what would you estimate as the average length of the population of cockroaches? How sure of the estimate are you? • The average cockroach length can be est. by the mean length of the sample ; 1.5 inches. • This is a questionable estimate because our sample is so small.
Connecting Transformations and z-scores Shape: The shape of z-score distributions would be the same shape of the original distribution. Center: The mean of a z-score distribution becomes 0. Spread: The standard deviation of a z-score distribution becomes 1.