Download
1 / 14
140 likes | 261 Views
PHY Performance Evaluation with 60 GHz WLAN Channel Models. Date: 2010-05-20. Authors:. Abstract.

E N D
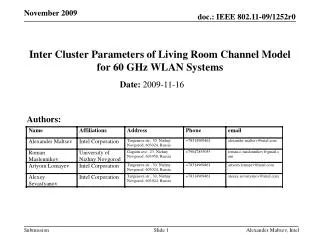
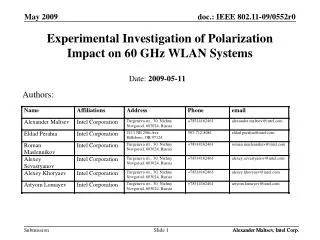
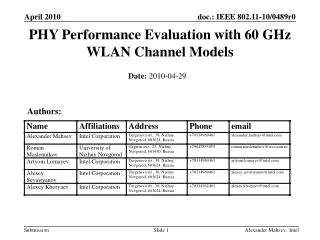
PHY Performance Evaluation with 60 GHz WLAN Channel Models Date: 2010-05-20 Authors: Alexander Maltsev, Intel
Abstract This contribution presents the simulation results for PHY performance evaluation in terms of Packet Error Rate (PER) characteristics as functions of Signal-to-Noise Ratio (SNR) over 60 GHz channel models for the Conference Room, Living Room, and Enterprise Cubicle environments describing in [1]. Alexander Maltsev, Intel
Introduction • The goal of this contribution is to illustrate PHY performance (PER vs SNR curves) over developed 60 GHz channel models for the Conference Room (CR), Living Room (LR) and Enterprise Cubicle (EC) environments [1]. • Simulation results were obtained for OFDM modulation and FEC scheme which is a standard Convolutional Code with polynomials {1338,1718}. Alexander Maltsev, Intel
PHY Channel Impulse Response Assumptions In accordance with EVM document [2]: • Channel impulse response should be normalized on an instantaneous basis (packet-by-packet). Instantaneous normalization of the CIRs is performed after application of beamforming. • Isotropic and basic steerable antenna model with directional antenna pattern defined as a Gaussian function with 300 mainlobe beamwidth and -20 dB backlobe may be applied on both TX and RX sides [1]. • Directional TX and RX antenna patterns are steered toward the Maximum Power Ray (MPR beamforming) [1]. Alexander Maltsev, Intel
Simulated Channel Models • AWGN channel model • Simulated scenarios for Conference Room channel model: • STA-STA sub-scenario, omni TX to omni RX, LOS, w/o beamforming, w/o polarization support • STA-STA sub-scenario, directional TX to directional RX, NLOS, MPR beamforming, w/o polarization support • STA-STA sub-scenario, omni TX to directional RX, NLOS, MPR beamforming, w/o polarization support Note: Simulation results for STA-AP sub-scenario are not provided. STA-AP sub-scenario has the same PER vs SNR performance for MPR beamforming as an STA-STA sub-scenario due to the same intra cluster channel model parameters. • Simulated scenarios for Living Room channel model: • Omni TX to omni RX, LOS, w/o beamforming, w/o polarization support • Directional TX to directional RX, NLOS, MPR beamforming, w/o polarization support • Omni TX to directional RX, NLOS, MPR beamforming, w/o polarization support • Simulated scenarios for Enterprise Cubicle channel model: • Omni TX to omni RX, near STA location, LOS, w/o beamforming, w/o polarization support • Directional TX to directional RX, far STA location, NLOS, MPR beamforming, w/o polarization support • Omni TX to directional RX, far STA location, NLOS, MPR beamforming, w/o polarization support • Note: Hardware impairments, timing acquisition, preamble detection, channel estimation and other impairments are not considered. Alexander Maltsev, Intel
Summary of Main System Parameters of Simulated OFDM System Alexander Maltsev, Intel
Comparison of PER System Performance for LOS CR, LR, and EC Channel Models for Omni-to-Omni Antenna Configuration with AWGN Reference Curves For PER=10-3 threshold: • CR PER curves for MCSs with code rate ½ have degradation in comparison with AWGN reference performance ~0.4-0.7 dB. • CR PER curves for MCSs with code rate ¾ have degradation in comparison with AWGN reference performance ~1.4-1.9 dB. • LR PER curves for MCSs with code rate ½ have degradation in comparison with AWGN reference performance ~1.2-1.6 dB. • LR PER curves for MCSs with code rate ¾ have degradation in comparison with AWGN reference performance ~3.5-4.0 dB. • EC PER curves for STA near location scenario demonstrate approximately the same performance as for LR model (the difference is less than 0.3 dB). Alexander Maltsev, Intel
PER System Performance for Different MCSs for NLOS CR Channel Model • d-d – directional TX to directional RX • o-d – omni TX to directional RX • For PER=10-3 threshold, CR PER curves for different MCSs for omni-to-directional antenna configuration in comparison with directional-to-directional case have performance loss ~0.3-1.5 dB. Alexander Maltsev, Intel
PER System Performance for Different MCSs for NLOS LR Channel Model • d-d – directional TX to directional RX • o-d – omni TX to directional RX • For PER=10-3 threshold, LR PER curves for different MCSs for omni-to-directional antenna configuration in comparison with directional-to-directional case have performance loss ~0.8-2.0 dB. Alexander Maltsev, Intel
PER System Performance for Different MCSs for NLOS EC Channel Model • d-d – directional TX to directional RX • o-d – omni TX to directional RX • For PER=10-3 threshold, EC PER curves (far location scenario) for different MCSs for omni-to-directional antenna configuration and directional-to-directioanal configuration have approximately the same performance (the difference is less than 0.2 dB). Alexander Maltsev, Intel
Comparison of PER System Performance for NLOS CR, LR, and EC Channel Models for Directional-to-Directional Antenna Configuration with AWGN Reference Curves • d-d – directional TX to directional RX • For PER=10-3 threshold CR and LR PER curves demonstrate similar system performance. In opposite case, EC curves have sufficient degradation. • For MCSs with code rate ½: • CR (or LR) PER curves have degradation in comparison with AWGN reference curves equal to ~ 1.5-2.0 dB. • EC PER curves have degradation in comparison with AWGN reference curves equal to ~ 2.9-3.6 dB. • For MCSs with code rate ¾: • CR (or LR) PER curves have degradation in comparison with AWGN reference curves equal to ~ 3.5 – 4.0 dB. • EC PER curves have degradation in comparison with AWGN reference curves equal to ~ 6.3-7 dB Alexander Maltsev, Intel
Comparison of PER System Performance for NLOS CR, LR, and EC Channel Models for Omni-to-Directional Antenna Configuration • o-d – omni TX to directional RX For PER=10-3 threshold: • LR PER curves for different MCSs in comparison with CR PER curves have performance loss ~ 0.3 dB. • EC PER curves (far location scenario) for different MCSs in comparison with CR PER curves have performance loss ~ 1-1.8 dB. Alexander Maltsev, Intel
Conclusion • This contribution illustrates PHY performance evaluation in terms of Packet Error Rate (PER) characteristics as functions of Signal-to-Noise Ratio (SNR) for OFDM modulation and simple FEC scheme over 60 GHz channel models for the Conference Room, Living Room and Enterprise Cubicle environments. Alexander Maltsev, Intel
References • IEEE doc. 802.11-09/0334r8. Channel models for 60 GHz WLAN systems, A. Maltsev et al, Mar. 2010. • IEEE doc. 802.11-09/0296r16. TGad Evaluation Methodology, Eldad Perahia, Jan. 2010. Alexander Maltsev, Intel