Download
1 / 12
120 likes | 204 Views
Finding Equations of Proportionality and Plotting Co-ordinates. Slideshow 26, Mathematics Mr Richard Sasaki Room 307. Objectives. Understand how to calculate the constant of proportionality, k Be able to construct tables from given equations for and

E N D
Finding Equations of Proportionality and Plotting Co-ordinates Slideshow 26, Mathematics Mr Richard Sasaki Room 307
Objectives • Understand how to calculate the constant of proportionality, k • Be able to construct tables from given equations for and • Begin to plot graphs for such equations
Constant of proportionality When , there exists the constant of proportionality, k (which can take any number). If we are given the value of and at a specific point, we can calculate k. (If at this point, we know and , we can find k.) We can then substitute the value for k into the expression.
Try the first worksheet! Example Let . When . Write an equation for in terms of . As , we can say that (where k is the constant of proportionality.) When Now, let’s substitute k = -2 back into our equation.
2 -3 3 4 -1 -16 -1/3 k=2, 4, ½, -½, 6, -2 This is always true for directly proportional variables so this works for all cases (gives us no information). If 3 , as if . can’t equal 3.
Building tables of co-ordinates We have had a lot of practice at building tables from equations. Let’s try an example. Make a table for the equation for integers where . We can now plot these as points on a graph! We call these points co-ordinates.
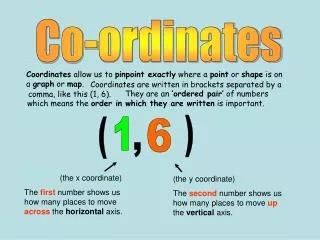
co-ordinates Co-ordinates are notated where values of and are inserted. From the table above, we get… Let’s plot these co-ordinates onto a graph.
Graphs Wait a minute, what’s a graph? Let’s check some key points. Co-ordinates are written . Title -axis What co-ordinate is this? -axis (2, 3) Gridlines
Plotting co-ordinates Finally let’s plot the points from before! They are… Go right 0 and up 0. Go right 1 and up 3. Go right 2 and up 6. Go right 3 and up 9.
Plotting co-ordinates Finally let’s plot the points from before! They are… Note: If co-ordinates on the table don’t fit, don’t worry about it! Next, let’s connect the points and make our line! Great! Try the last worksheet!
Answers The first line shows direct proportion as it passes through (0, 0). The second doesn’t.