Download

1 / 29
290 likes | 460 Views
Pegasus: Precision Hunting for Icebergs and Anomalies in Network Flows. Sriharsha Gangam 1 , Puneet Sharma 2 , Sonia Fahmy 1 1 Purdue University, 2 HP Labs. This research has been sponsored in part by GENI project 1723 , and by Hewlett -Packard. Passive Flow Monitoring.

E N D
Pegasus: Precision Hunting for Icebergs and Anomalies in Network Flows Sriharsha Gangam1, Puneet Sharma2, Sonia Fahmy1 1Purdue University, 2HP Labs This research has been sponsored in part by GENI project 1723, and by Hewlett-Packard
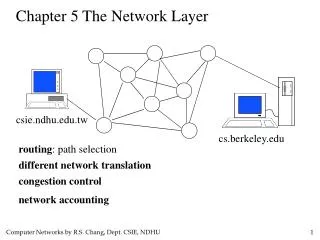
Passive Flow Monitoring • Detect network congestion, attacks, faults, anomalies, traffic engineering and accounting • Observe and collect traffic summaries • e.g., InMon traffic sentinel [InMon] uses sFlow, Cisco’s NetFlow is used in ISPs Monitoring Data Collection & Analysis Network Devices e.g., switches [InMon] http://inmon.com
Passive Flow Monitoring - Challenges • Large overhead to collect and analyze fine-grained flow data • Increasing link speeds, network size and traffic • Limited CPU, memory resources at the routers • Millions of flows in ISP networks • Current Techniques? • NetFlow sampling rate in ISPs ~ 1 in 100 (Internet2) • sFlow packet sampling rate ~ 1 in 2000 • Application dependent sketches • Fine-grained information is lost
Will More Resources Help? • Commercial co-located compute and storage • HP ONE Blades • Cisco SRE Modules • Example configuration • 2.20 GHz Core Duo processor • 4 GB RAM, 250 GB HD • 2x10 Gbps duplex bandwidth to switch • Storage and Analysis of fine-grained flow statistics • Distributed monitoring applications
Design Space Our Goals: Pegasus - Accurate & low overhead monitoring Naïve Solution Ideal Solution Additional Compute & Storage Impractical Accuracy Current Solutions: Sampling and Sketching Network Overhead
Key Class of Applications • Network bottlenecks • Top traffic destinations, sources, and links • Suspicious port scanning activity • Sources that connect to more than 10% hosts within time T • DDoSattack detection • Destinations with large number of connections or traffic
Global Iceberg Detection • Items with aggregate count exceeding a threshold (S xθ) • Global heavy hitters • Observations at any single switch/router may not be significant or interesting • E.g., DDoS attack Monitoring Data Items contributing > 1% (θ) traffic? Network Devices e.g., switches
Online Iceberg Detection with Pegasus • Reduce communication overhead • Additional compute and storage • Precisely detect all global icebergs • zero false positives and false negatives • Feedback based iterative approach Iterative solution High precision
Comparison of Different Approaches Naïve Approach Sampling and Sketching Pegasus Lossy Summary: False +ves and -ves Prohibitively large Monitoring Data Lossy Summary: Sketch-sets Collection & Analysis (Aggregator) Monitor Fine-grained data on-demand: No False +ves or -ves Network Devices e.g., switches
1- D Sketch-set Representation • Sketch-set: Summary representation of a collection of flows, supports set operations Coarse Sketch-set Generation (Destination IP, Packet Count) 128.41.10.10, 15 128.41.10.20, 20 128.41.10.30, 15 128.41.10.40, 30 128.41.10.50, 25 128.41.10.110, 110 128.41.10.150, 100 128.41.10.210, 300 (startIP, endIP, minPkt, maxPkt) α 128.41.10.10, 128.41.10.50, 15, 30 128.41.10.110, 128.41.10.150, 100, 110 128.41.10.210, 128.41.10.210, 300, 300 Coarse-grained sketch-sets β • Example: Destinations IPs receiving more than 200 packets
Example INTERSECTION SUBTRACTION Coarse-grained Sketch-sets Disjoint Sketch-sets Non-icebergs (startIP, endIP, minPkt, maxPkt) Aggregator 128.41.10.10, 128.41.10.50, 15, 30 128.41.10.110, 128.41.10.150, 100, 110 128.41.10.210, 128.41.10.210, 300, 300 128.41.10.10, 128.41.10.34, 15, 30 128.41.10.35, 128.41.10.50, 10, 65 128.41.10.51 , 128.41.10.70, 10, 35 128.41.10.100, 128.41.10.109, 90, 130 128.41.10.121, 128.41.120.150, 100, 110 128.41.10.110, 128.41.10.120, 90, 240 128.41.10.210, 128.41.10.210, 300, 300 Monitor 1 Monitor 2 128.41.10.35, 128.41.10.70, 10, 35 128.41.10.100, 128.41.10.120, 90, 130 Query monitors (uncertain) Iceberg
Example…Query Response Aggregator Query: (128.41.10.110, 128.41.10.120) 128.41.10.110, 110 128.41.10.110, 128.41.10.110, 110, 110 Generate Sketch-sets (finer granularity) Lookup relevant flows Monitor 1 Monitor 2 128.41.10.110, 128.41.10.110, 90,90 128.41.10.120, 128.41.10.120, 130, 130 128.41.10.110, 90 128.41.10.120, 130
Example…Query Response Aggregator Query: (128.41.10.110, 128.41.10.120) Fine-grained sketch-sets Iceberg 128.41.10.110, 128.41.10.110, 110, 110 Aggregator Monitor 1 128.41.10.110, 128.41.10.110, 200, 200 128.41.10.120, 128.41.10.120, 130, 130 Monitor 2 128.41.10.110, 128.41.10.110, 90,90 128.41.10.120, 128.41.10.120, 130, 130 Non-icebergs
Evaluation Methodology • Abilene trace • Netflow records: 11 sites with 1 in 100 sampling for 5 min • Add small flows to revert sampling • (90% of flows contribute to 20% of traffic, ~ 758K unique flow records) • Trace is used in [Huang11] • Enterprise network sFlow trace • sFlow records: 249 switches,1 in 2000 sampling for a week • Revert sampling by adding flows • PlanetLab’s Outgoing Traffic • NetFlow records generated at each PlanetLab host [Huang11] G. Huang, A. Lall, C. Chuah, and J. Xu. Uncovering global icebergs in distributed streams: Results and implications. J. Netw. Syst. Manage., 19:84–110, March 2011
Comparison with Sample-sketch • Sends sampled monitoring data and sketches to the aggregator for iceberg detection • Uses two main parameters • Sampling interval • Sketch threshold • Difficult to decide the parameters • Can have false positives and false negatives G. Huang, A. Lall, C. Chuah, and J. Xu. Uncovering global icebergs in distributed streams: Results and implications. J. Netw. Syst. Manage., 19:84–110, March 2011
Abilene Trace θ Larger is better • For the 5 min trace, θ= 0.08 • Naive solution: ≈ 7.63 MB • Pegasus:≈ 8 KB • Sample-Sketch:≈36 KB Pegasus has lower communication overhead θ
Monitoring Outgoing PlanetLab Traffic • Example of end-host monitoring system • Detect accidental attacks and anomalies originating from PlanetLab • Existing monitoring service: PlanetFlow • Decouples collection from analysis • Collects 1 TB of data every month [PF] (naïve approach) Monitor PlanetLab nodes Aggregator NetFlow records generated from outgoing traffic Monitor [PF] http://www.cs.princeton.edu/~sapanb/planetflow2/
Pegasus PlanetLab Service • PlanetLab’soutgoing traffic • NetFlow records of~250 PlanetLab nodes • Online global iceberg detection service • Global Iceberg detection for • Flow identifier: Destination IP, Source Port, Destination Port • Flow size: Packet count
Pegasus PlanetLab Service • 15 hour deployment - Pegasus: 403 MB, Naïve: 2.26 GB • Most outbound traffic to other PlanetLab hosts • 1- Day outgoing traffic: • CoDNS and CoDeeNdon’t produce many icebergs
Conclusions • Pegasus: A distributed measurement system • Commercial co-located compute and storage devices • Low network overhead • High accuracy • Adaptive aggregation for the global iceberg detection • Iterative feedback solution • Experiments from real traces and PlanetLab deployment • low overhead without false +ves and -ves
Thank you Questions?
Anomaly Examples • Based on traffic features [Kind09] [Kind09] Histogram-Based Traffic Anomaly Detection, In IEEE Trans. on Netwk. Service Management
Related Work • Threshold Algorithm (TA) [Fagin03] • Large number of iterations • Three phase uniform threshold (TPUT) [Cao04] • Accounting data distributions [Yu05] • Filtering based continuous monitoring algorithms [Babcock03] [Keralapura06] [Olston03] • Send update to aggregator when local arithmetic constraints fail [Fagin03] Optimal aggregation algorithms for middleware. Jour. of Comp. and Sys. Sciences, 2003 [Cao04] Efficient Top-K Query Calculation in Distributed Networks. In proc. of PODC, 2004 [Yu05] Efficient processing of distributed top-k queries. In Proc. of DEXA, 2005 [Babcock03] Distributed top-k monitoring. In Proc. SIGMOD, 2003 [Keralapura06] Communication-efficient distributed monitoring of thresholded counts. In Proc. of SIGMOD, 2006 [Olston03] Adaptive filters for continuous queries over distributed data streams. In Proc. SIGMOD, 2003
Sketch-set Granularity - G • High granularity ⇒ More precise, more expensive representation • Granularity definition: maxSize – minSize • Used to determine if more flows should be combined in a sketch-set • Used to send finer granularity during monitor response (for convergence)
Abilene Trace β little influence on the communication cost
Enterprise Network sFlow Trace Larger is better All except one parameter pair (green) has false positives and negatives
Scalability with Number of Monitors Larger is better sFlow trace Abilene trace