Download
1 / 23

E N D
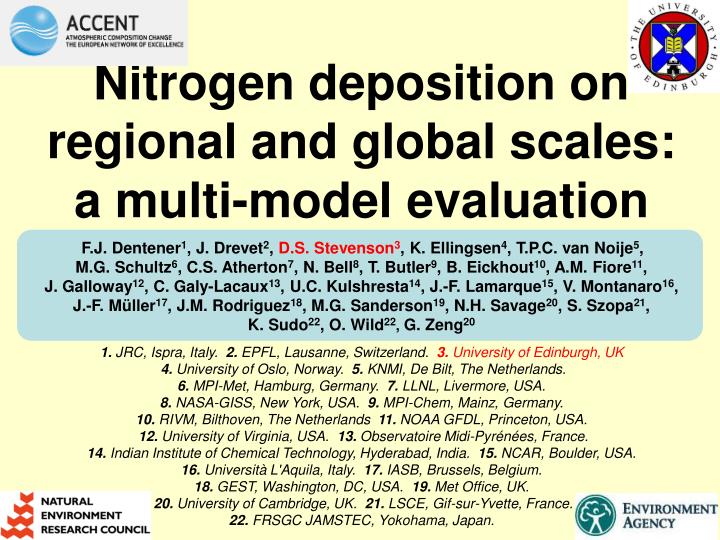
Nitrogen deposition on regional and global scales: a multi-model evaluationF.J. Dentener1, J. Drevet2, D.S. Stevenson3, K. Ellingsen4, T.P.C. van Noije5, M.G. Schultz6, C.S. Atherton7, N. Bell8, T. Butler9, B. Eickhout10, A.M. Fiore11, J. Galloway12, C. Galy-Lacaux13, U.C. Kulshresta14, J.-F. Lamarque15, V. Montanaro16, J.-F. Müller17, J.M. Rodriguez18, M.G. Sanderson19, N.H. Savage20, S. Szopa21, K. Sudo22, O. Wild22, G. Zeng201. JRC, Ispra, Italy. 2. EPFL, Lausanne, Switzerland. 3. University of Edinburgh, UK4. University of Oslo, Norway. 5. KNMI, De Bilt, The Netherlands. 6. MPI-Met, Hamburg, Germany. 7. LLNL, Livermore, USA. 8. NASA-GISS, New York, USA. 9. MPI-Chem, Mainz, Germany. 10. RIVM, Bilthoven, The Netherlands 11. NOAA GFDL, Princeton, USA. 12. University of Virginia, USA. 13. Observatoire Midi-Pyrénées, France. 14. Indian Institute of Chemical Technology, Hyderabad, India. 15. NCAR, Boulder, USA.16. Università L'Aquila, Italy.17. IASB, Brussels, Belgium. 18. GEST, Washington, DC, USA. 19. Met Office, UK. 20. University of Cambridge, UK. 21. LSCE, Gif-sur-Yvette, France.22. FRSGC JAMSTEC, Yokohama, Japan.
Future changes in composition related to emissions 1 year runs Future changes in composition related to climate change 5-10 year runs ACCENT intercomparison (Expt. 2) • Focus on 2030 – of direct interest to policymakers • Go beyond radiative forcing: also consider ozone AQ, N- and S-deposition, and the use of satellite data to evaluate models • Present-day base case for evaluation: • S1: 2000 • Consider three 2030 emissions scenarios: • S2: 2030 IIASA CLE (‘likely’) • S3: 2030 IIASA MFR (‘optimistic’) • S4: 2030 SRES A2 (‘pessimistic’) • Also consider the effect of climate change: • S5: 2030 CLE + imposed 2030 climate
Global NOx emission scenarios SRES A2 CLE MFR 2000 2030 Figure 1. Projected development of IIASA anthropogenic NOx emissions by SRES world region (Tg NO2 yr-1).
Other emissions categories • EDGAR3.2 ship emissions, and assumed 1.5%/yr growth in all scenarios • Biomass burning emissions from van der Werf et al. (2003) – assumed these remained fixed to 2030 in all scenarios • Aircraft emissions from IPCC(1999) • Modellers used their own natural emissions • Specified fixed global CH4 for each case (from earlier transient runs)
Requested model diagnostics • Monthly mean, full 3-D • O3, NO, NO2, CO, OH, … • O3 budget terms • CH4 + OH • NOy, NHx and SOx deposition fluxes • T, Q, etc. for climate change runs • Daily NO2 column (GOME comparison) • Hourly surface O3 (for AQ analysis) • NETCDF files submitted to central database
CHASER_CTM CHASER_GCM FRSGC/UCI GEOS-CHEM GISS GMI/CCM3 GMI/DAO GMI/GISS IASB LLNL-IMPACT LMDz/INCA-CTM LMDz/INCA-GCM MATCH-MPIC/ECMWF MATCH-MPIC/NCEP MOZ2-GFDL MOZART4 MOZECH MOZECH2 p-TOMCAT STOCHEM-HadAM3 STOCHEM-HadGEM TM4 TM5 UIO_CTM2 ULAQ UM_CAM 26 Participating Models CTMs driven by analyses CTMs coupled to GCMs CTMs driven by GCM output
Mean model v Obs. HNO3 Wet dep. N. AMERICA EUROPE AFRICA E. ASIA
Mean model v Obs. NH4 Wet dep. N. AMERICA EUROPE AFRICA E. ASIA
Different model resolutions 3°x3° 1°x1° Meanmodel 5°x5°
Changes in NOy dep 2000-2030, under 3 scenarios IIASA CLE IIASA MFR SRES A2
Changes in NHx dep 2000-2030, under 2 scenarios IIASA CLE SRES A2
Annual NO emission & NOy deposition (per unit area) by region(mean model)
Annual NH3 emission & NHx deposition (per unit area) by region(mean model)
Fraction of NOy deposition to natural vegetation, agriculture/urban, soil/desert, and water/ice
Fraction of NHx deposition to natural vegetation, agriculture/urban, soil/desert, and water/ice