Download
1 / 101
1.01k likes | 1.14k Views
Looking ahead: Will Free-growing stands produce the volumes we expect?. Wendy Bergerud Research Branch Ministry of Forests and Range December, 2009. Planning for the future. What do we want our forests to look like?

E N D
Looking ahead: Will Free-growing stands produce the volumes we expect? Wendy Bergerud Research Branch Ministry of Forests and Range December, 2009
Planning for the future • What do we want our forests to look like? • After harvesting a stand or group of stands, we usually reforest them so that we can get . . . ?? • What is our target/goal? • We must make decisions now hoping that they will have the right long-term effect.
From here to there? • How do we assess how recently reforested areas are doing? Whether we are likely to get the desired volume from that stand(s)? • This means that we want a way to measure how a stand is doing NOW in order to predict whether we are likely to get the desired outcome at rotation. • I am going to talk about which measure of density sampled NOW will do the trick. • This is more of a “methods” talk.
Key Messages • TASS and TIPSY now have well-spaced density, free-growing density, and mean stocked quadrants as output variables. • Can use to project volume at rotation • Modeling young stands still hampered by lack of information on: • Ingress • Forest Health • Vegetation Competition • Mixed species and uneven aged stands
Key Messages • Spatial distribution is very important when projecting volumes at rotation for current densities. • So is Site Index. • Under optimum conditions, well-spaced density 10 to 20 years after FG declaration should be about the same. The free-growing density might actually increase. • Modeling stand dynamics with TASS and TIPSY require a good understanding of the assumptions that must be made.
Density & Volume with Stand Age Projected Volume Density
Factors affecting the prediction of projected merchantable volume as a function of density include: • Species • Site Index • Spatial Distribution • Growth Model used • Other factors? • Health Effects • Competition • Unexpected events (e.g. MPB)
Discussion Assumptions • Spatially homogeneous, even-aged stands. • No brush or competition issues • No forest health issues or unexpected events • No OAFs • Minimum inter-tree distance (MITD) is 2.0 m • Minimum height to be free-growing is 2.0 m • Well-spaced and free-growing density are all “uncapped” estimates.
Discussion Assumptions • Preliminary results – I reserve the right to correct, if necessary • Look at the TRENDS, not the specific numbers • The TRENDS are more likely to remain the same under a different set of assumptions than would the specific numbers presented.
Different Types of Density • Nominal- TASS input (often called Initialdensity) • Total- All trees (regardless of spacing) • Well-spaced- depends on choice of MITD • FG- Well-spaced with height restriction • MSQ– Mean stocked quadrant (All count only acceptable trees)
Total DensityAll trees or all healthy trees Total: 19 trees 3800 sph 50 m2 plot 2 m
Well-spaced DensityAll trees a Minimum Inter-tree Distance (MITD) apart WSP: 9 trees 1800 wsph 50 m2 plot 2 m
Free-growing DensityWell-spaced trees taller than a minimum height Remove Short Trees First 50 m2 plot 2 m
Free-growing DensityWell-spaced trees taller than a minimum height Now look at the well-spaced trees remaining FG: 6 trees 1200 fgsph 50 m2 plot 2 m
Mean Stocked Quadrant (MSQ)Count of acceptable tree in each quadrant ? MSQ: 3 filled quadrants or, is it 4? 50 m2 plot2 m
Example Density Map showing spatial distributions • 900 sph (nominal density)
Whichtype of Density to use? (assuming even-aged stands) • Total- All trees (regardless of spacing) • Easy to measure • Projected Merchantable Volume (PMV) is sensitive to site index misspecification • PMV very sensitive to spatial distribution misspecification
Which type of Density to use? (assuming even-aged stands) • Well-spaced- depends on choice of MITD. • Not so easy to measure but • PMV less sensitive to spatial distribution misspecification • FG- Well-spaced with height restriction • More sensitive to site index and to • Stand age for ages less than 30 years or so • (and in the field, more sensitive to brush and competition)
Which type of Density to use? (assuming even-aged stands) • MSQ– Mean stocked quadrant • Easier to measure • PMV less sensitive to spatial distribution misspecification • Not as familiar to foresters • Capped at 4 which occurs at all higher densities even extremely high densities
Stands with the same WS density produce about the same Volume
But, what about all those trees? Green: Regular at 1276 Red: Natural at 2500 Blue: Clumpy(3) at 3460 Black: Clumpy(2) at 3906 Purple: Clumpy(1) at 6944
Density values at 15 years(about 700 wsph) Projected volumes not as close for lower well-spaced densities
But, what about all those trees? Green: Regular at 816 Red: Natural at 1111 Blue: Clumpy(3) at 1372 Black: Clumpy(2) at 1736 Purple: Clumpy(1) at 3086
What spatial distribution to use? • How can we tell from field data which spatial distribution best matches the stand? • There are several indices in the literature, e.g. Pielou’s index of dispersion or Morisita’s index. • We could also consider the ratio of the total trees to the well-spaced trees, both readily available from survey data. Preliminary work shows that this ratio is a simple function of the total trees. • I’ve been thinking about this for years, but haven’t been able to pull anything together yet.
Fort St John District Data • District collected 895 standard silviculture survey plots in many but not all of the Multi-block strata of the Fort St John Pilot Project (15 year old cutblocks) • Also collected MSQ data – plots divided into quadrants and presence of an acceptable tree determined for each quadrant – values 0 to 4. • Plots placed into 18 strata, regardless of cutblocks • Three species groups: Pl, Pl/Sx, Sx • Wide range of site index observed
WS and FG vs Total DensityFort St John District Data Data plotted without regard to estimated site index of the data
MSQ vs Total & WS DensityFort St John District Data Data plotted without regard to estimated site index of the data
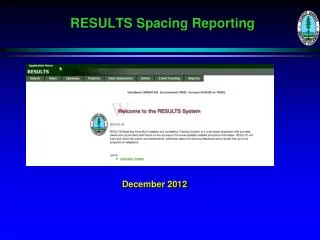
Post-free growing Survey Study • FREP project with Alex Woods in Smithers • Sixty stands in two areas declared free-growing between 1987 and 2001 were randomly selected using RESULTS • Stands re-surveyed in 2005 (Lakes) and 2006 (Okanagan) using standard silviculture survey methodology and current forest health standards. • FREP is now piloting a Stand Development Monitoring (SDM) program based on this work.
Purpose of Free-Growing Policy: • “free-growing requirements ensure that reforested stands remain successfully reforested.” Forest Practices Board Special Report No. 16 (2003), • The licensee obligation to create free-growing stands is one of the few measurable results under the Forest and Range Practices Act.
Features of the Silviculture Survey • Uses 50 m2 plots (3.99 m radius -- 1/200th ha) • Usually 1 plot per hectare placed in survey area • Count number of acceptable, well-spaced trees • Trees must be a minimum tree height to be counted in Free-growing surveys • Well-spaced is defined by the Minimum Inter-tree Distance (MITD) • Count is capped by the M-value(this is the equivalent plot count for the Target Stocking Standard, TSS, i.e., M = TSS/200)
WS Density vs Total DensityLakes & Okanagan Data At Declaration At Post FG Survey Dot colours show different age range of the cutblocks Curves use stand age of 15 or 25 years
WS Density vs Total DensityLakes & Okanagan Data At Declaration At Post FG Survey Dot colours show cutblocks from different areas Curves use stand age of 15 or 25 years
Post FG Question: • Should stands at 25 years of age (or older) have about the same well-spaced and free-growing densities as at declaration? • Or should these values have decreased, and if so, by how much? • Used TASS and TIPSY with the new output density variables to assess this.
Post FG Question: Total density at age 15 are shown above each curve Nominal Densities were 3906, 2500, 1600, and 1111 Solid lines show Well-spaced Densities Dashed lines are Free-growing Densities