Download
1 / 65
650 likes | 795 Views
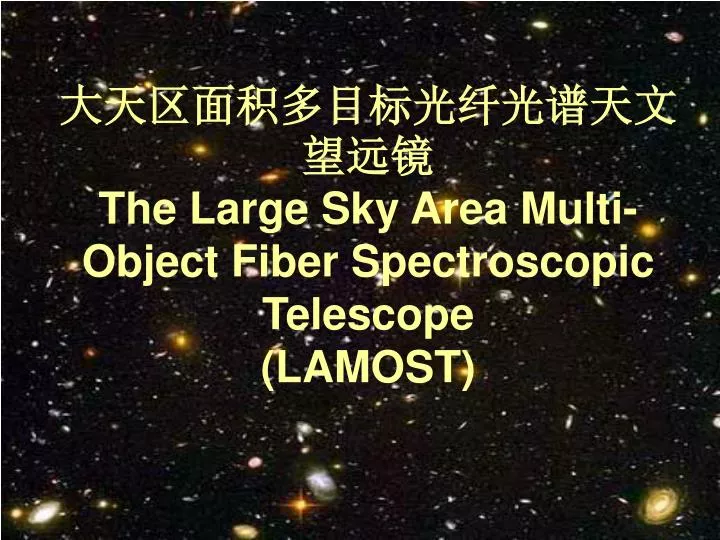
大天区面积多目标光纤光谱天文望远镜 The Large Sky Area Multi-Object Fiber Spectroscopic Telescope (LAMOST). The Scientific Case For LAMOST. Basic parameters of LAMOST. 4-meter Schmidt telescope The declination of observable sky area ranges from -10 to +90 . 20 square degree of the FOV 4000 fibers

E N D
大天区面积多目标光纤光谱天文望远镜The Large Sky Area Multi-Object Fiber Spectroscopic Telescope(LAMOST)
Basic parameters of LAMOST • 4-meter Schmidt telescope • The declination of observable sky area ranges from -10 to +90. • 20 square degree of the FOV • 4000 fibers • Spectrum resolution: VPH (Volume Phase Holographic) Grating R=1000, 2000, 5000, 10000
LAMOST was designed primarily as an efficient redshift engine • Challenge: After 2dF and SDSS • Opportunity: the gap of between number with and without spectral data still grow up The requirement of spectroscopic observation for large number of objects in large sky area is more urgent than ever before • Next generation Large telescope need large survey data set to find interested objects
How can we do better than 2dF and SDSS • Large Aperture • Large field of view • More fibers What we try to do: • increasing the spectral resolution • Carefully select the targets • better sky subtraction • spectrophotometer
Key Projects • Extra-galactic spectroscopic survey — Galaxy and QSO redshift survey • Stellar spectroscopic survey — Structure of the Galaxy, and so on. • Cross identification of multi-waveband survey.
1999.12 LAMOST与银河系的结构的演化讨论 (北京香山) • 2001.11 2dF与SDSS巡天结果讨论会 (北京国台) • 2003.9 LAMOST科学目标小型研讨会 (北京国台) • 2003.9 多波段河外巡天观测研讨会 (河北张北) • 2003.11 LAMOST与银河系研究专题研讨会 (浙江杭州) • 2004.8 LAMOST与银河系结构与演化研讨会 (吉林延吉) • 2005.4 LAMOST科学目标研讨会(2005) (江西井冈山) • 中德、中法、中英双边科学研讨会 • 成立了LAMOST科学目标工作小组
LAMOST survey strategy • general survey vs. surveys with specific purpose? • complete coverage vs. large effective volume? • Tracers (color selected high redshift galaxy? quasar?) • optimal scale for survey • competition with other survey:
Strategies of galaxy redshift survey • Magnitude limited (B=20.5) sample Intrinsic faint object with mean z=0.2 • Luminous Red Galaxy (LRG) Deep: 0.3 < z < 0.8
Redshift survey of Galaxy Low Resolution spectroscopy: • To obtain the spectra of faint celestial objects (Galaxy and AGN) down to 20.5m with 1nm spectral resolution in 1.5 hours exposure. • Wavelength range: 370—900 nm • Dark night
Sky Coverage Advantage over small survey • Cosmic variance • Finite Sampling • Edge Effect Disadvantage for the large Sky Area Survey • Long time projects
LOCAL REDSHIFT SURVEY After 2dF and SDSS • Make big local leaps in surveysize/volume • Galaxy clustering depend the subset of galaxies: color, luminosity, type,… • The redshift-space distortion of the large-scale clustering • Topology of Large Scale Structure
Clustering per Spectral Type Correlation functions (Madgwick el al. 2003) Stochastic biasing (Wild et al. 2004)
To measure higher-order clustering statistics of the galaxy distribution • determine the bias parameter b, revealing the relationship between the distributions of mass and light and yielding a direct measure of Ω. • establish whether the galaxy distribution on large scales is a Gaussian random field, as predicted by most inflationary models of the early universe • investigate the non-linear growth of clustering in the small-scale galaxy distribution.
Cluster of galaxies • Cataloged of cluster of galaxies and supercluster • Space distribution of cluster and superclusters • Compare with x-ray selected cluster of galaxies • Cluster evolution
Calibrating the Photo-z sample • SED (Spectrial Energy Distribution) • Redshift error distribution In order to calibrating the photo-z sample, we need the similar color and magnitude range spectroscopic redshift sample
Baryon oscillations • provide a standard rod for mapping the evolution of the geometry of the universe with redshift • measure the equation of state of the dark energy
BARYON ACOUSTIC PEAK IN THE LARGE SCALE CORRELATION FUNCTION OF GALAXIES
Gravitational Lensing • Combine the high quality image of the lensing galaxy with powerful spectroscopy capabilities of LAMOST to conduct a deep wide-field spectroscopic sample of all these galaxies, it will be very helpful for the test of the distribution of Dark matter
LRG sample Advantage to select LRG • Red color → easy to find the candidate • Most luminous galaxy → Map large cosmological volume • Correlated with cluster → To detect and study the clustering
The SDSS colour selection of LRGs is very efficient, so it could be make an large cosmological volume sample with high completeness and reliability.. • Complementing to SDSS LRGs sample up to r < 20.5, to get galaxy redshift sample with 0.38 < z < 0.8 . • Overlap in redshift space between Galaxy and QSOs
Scientifically, there is a great benefit in having the two new surveys (Galaxy and QSOs) co-extensive since there is now a substantial overlap in redshift space, providing opportunities to compare the clustering and environments of the two classes of object.
High resolution spectrum for LRG • With VPH grating we may get the resolution up to R=5000-10000 • Line profiles information for the absorption line like CaII H & K, [OH]…… • Diagnostic of Galaxy dynamic, star formation AGN activity
GALAXY FORMATION AND EVOLUTION
Large Number of the galaxy Sample • When the objects are very faint, thousands of objects of the same type will need to be avarange to detect the required spectral feature
Stellar Populations in Low-Redshift Galaxies • Characterize the stellar pops and star-formation histories of the current galaxy population as a function of properties and environment at low-z • survey to characterize the stellar populations of galaxies (age, metallicity, star-formation history) as a function of global properties (luminosity, morphology, mass) and environment (local density/structures)
Old Stellar Populations at Early Epochs • Ages and metallicities of stellar populations in luminous red galaxies as a function of mass (velocity dispersion) at early epochs, from 0.45<z<0.7 • Goal: study formation and evolution of the oldest stellar populations by observing luminous red galaxies (LRGs) over 0.45<z<0.7 (follow-up of 2dF-SDSS
Method:obtain spectra at ~1Å resolution and S/N>30 to measure spectral indices (ages, metallicities, SFR histories) and velocity dispersions (masses); long time baseline resolves age-metallicity degeneracy in spectra
Emission line galaxies survey • Low metallicity blue compact galaxies • H II galaxies • Star-forming galaxies • Ly-break galaxies • QSO2
QSO survey • Combine the high quality digital image data of SDSS (5 colors) with powerful spectroscopic capabilities of LAMOST to conduct a deep wide field spectroscopic suevey for Quasars
Evolution of the quasar luminosity function • Spatial clustering of quasars as a function of Redshift • Redshift distortion of the Quasar space distribution • Discover the high Redshift QSOs: use g ,z band color to find QSO with z>3 up to 6 use IR color J.K.H. band color ( K~20) to find QSOs with z>7 K-excess selected QSO: obscured by dust. • Cross correlation between the QSOs and the foreground galaxies and cluster of galaxies:
QSO absorption studies • The clustering statistics of Lyman alpha absorption system
Galactic Structure and Evolution
It is evident that our own Milky Way galaxy is the only galaxy that we can presently study at sufficiently high spatial (and kinematical) resolution, and at sufficient depth, to address many of the open questions on the physics of galaxy formation
Stellar spectroscopy plays a crucial role in the study of our Galaxy, not only providing a key component of the 6-dimensional phase space of stellar positions and velocities, but also providing much-needed information on the chemical composition of individual stars. Taken together, information on space motion and composition can be used to unravel the formation process of the Galaxy.
Galactic Structure LAMOST will be able to detect and characterise stars in all of the major components of the Galaxy down to a magnitude limit of V~18 at low spectral resolution R=1000 or Middle spectral resolution for bright stars R=5000 - 10000
Sloan Extension for Galactic Underpinnings and Evolution(SEGUE) This project include both imaging and spectroscopy: The spectroscopy survey will obtain ~ 250,000 spectra of Galactic stars, with plates spread out across Galactic latitude and longitude. These observations consist of two plates at each of 200 directions (400 plates total). Each direction would include one 45-minute plate, similar in depth to the current SDSS survey, and one 1.5-hour, double-length plate. The deeper plates will yield S/N ~ 15 for objects as faint as g ~ 20.3, and S/N > 50 for g ~ 18.5, to increase the accuracy of the metallicity (and radial velocity) determinations for the fainter stars in each of the pointings.