Download

1 / 12
220 likes | 886 Views
SPSS Session 2: Hypothesis Testing and p -Values. Learning Objectives. Review Lectures 8 and 9 Understand and develop research hypotheses and know difference between them and the null hypothesis Define independent and dependent variables for a research hypothesis

E N D
Learning Objectives • Review Lectures 8 and 9 • Understand and develop research hypotheses and know difference between them and the null hypothesis • Define independent and dependent variables for a research hypothesis • Define probability and describe it’s relationship to statistical significance
Review of Lecture 8 • Defined and discussed the theory and rules of probability • Calculated probability and created a probability distribution with example data • Described the characteristics of a normal curve and interpreted a normal curve using example data
Review from Lecture 9 • Defined research hypothesis, null hypothesis and statistically significance • Discussed the basic requirements for testing the difference between two means • Defined and described the difference between the alpha value and P value, and Type I and Type II errors
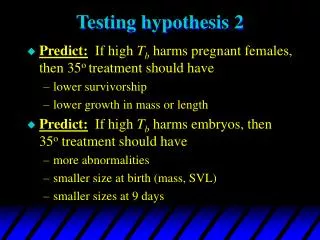
Research Hypotheses • Hypotheses give a testable and potentially falsifiable prediction about the relationship between two variables. • Designed to answer a research question of particular interest. • For example, in our child protection study, parent or carer stress was predicted to be significantly associated with the quality of the family environment. This was a central hypothesis. • Our research question was: Is parent or carer stress associated with the quality of the family environment?
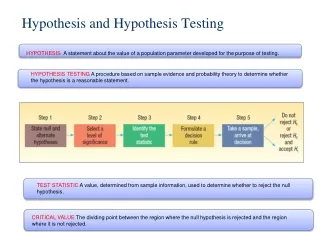
Research and Null Hypotheses • RESEARCH HYPOTHESIS • A proposed explanation for a phenomenon that can be tested • There is a relationship between two measured variables • A particular intervention makes a difference/has an effect NULL HYPOTHESIS • The opposite position of the hypothesis (usually) • There is no relationship between two measured variables • The particular intervention does not make a difference/has no effect
Research and NullHypotheses Examples RESEARCH HYPOTHESIS • Symbolized as “H1” • Parent or carer stress will be significantly associated with the quality of the family environment. NULL HYPOTHESIS • Symbolized as “H0” • Parent or carer stress will not be significantly associated with the quality of the family environment.
Alternative Hypotheses • Alternative or rival hypotheses may offer another explain on why two variables may or may not be associated • Alternative hypotheses are based on the information that you may not have collected or didn’t consider for every possible variable • Other variables can: • Be the actual cause • Alter the relationship between the two variables • It is important to read prior research literature before doing your research and data collection
Independent and Dependent Variables • Independent variables (IV) those variables of interest which are used to predict dependent variables (DV) • Independent variables are also called “Predictors”. • Dependent variables are also called “Outcomes”. • That is IV explain variation in DV. • For example, parent or carer stress (IV) was predicted to be significantly associated with the quality of the family environment (DV).
Probability • Research and quantitative tests produce results in probabilistic • Probability that the association found between an IV and DV occurred due to chance • Can also be said that the association between the IV and DV was statistically significant, and therefore not due to chance
Statistical Significance • In order to determine if something is statistically significant, you must establish a level of significance (represented by the Greek letter α [alpha]). • α = the level of probability where the null hypothesis can be rejected with confidence and the research hypothesis accepted with confidence • A common level of significance α = .05
Statistical Significance • In statistical analyses, we find the p-value of the association between two variables (IV and DV). • If the p-value is less than our α = .05 level of significance, when we reject our null hypothesisand accept our research hypothesis. • If the p-value is greater than our α = .05 level of significance, when we say that we retain or fail to reject our null hypothesis.