Download
1 / 19
190 likes | 264 Views
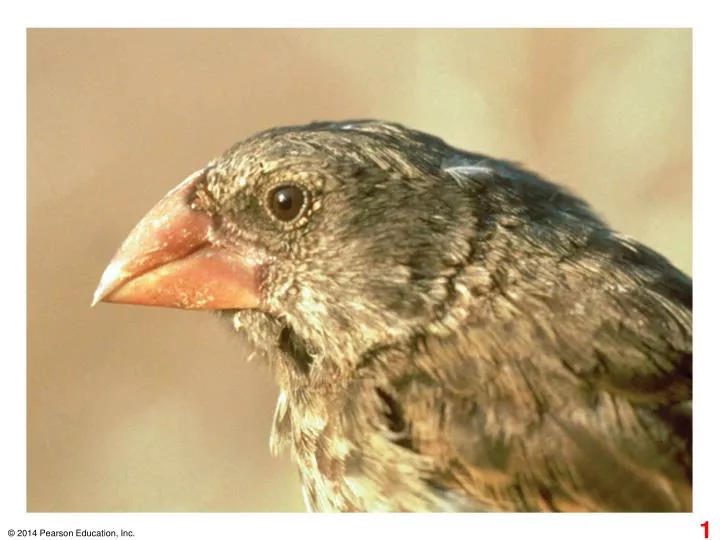
10. 9. Average beak depth (mm). 8. 0. 1976 (similar to the prior 3 years). 1978 (after drought). Base-pair substitutions. Insertion sites. 1. 500. 1,000. Intron. Exon. Substitution resulting in translation of different amino acid. Deletion. 1,500. 2,000. 2,500.

E N D
10 9 Average beak depth (mm) 8 0 1976 (similar to the prior 3 years) 1978 (after drought)
Base-pair substitutions Insertion sites 1 500 1,000 Intron Exon Substitution resulting in translation of different amino acid Deletion 1,500 2,000 2,500
(a) Caterpillars raised on a diet of oak flowers (b) Caterpillars raised on a diet of oak leaves
Porcupine herd MAP AREA CANADA ALASKA Beaufort Sea NORTHWEST TERRITORIES Porcupine herd range Fortymile herd range YUKON ALASKA Fortymile herd
Frequencies of alleles p frequency of CR allele 0.8 0.2 q frequency of CW allele Alleles in the population Gametes produced Each egg: Each sperm: 80% chance 20% chance 20% chance 80% chance
20% CW (q 0.2) 80% CR (p 0.8) Sperm CR CW p 0.8 q 0.2 CR p 0.8 0.64(p2) CRCR 0.16(pq) CRCW Eggs CW 0.16(qp) CRCW 0.04(q2) CWCW q 0.2 64% CRCR,32% CRCW,and4% CWCW Gametes of this generation: 64% CR (from CRCR plants) 16% CR (from CRCW plants) 80% CR 0.8 p 16% CW (from CRCW plants) 4% CW (from CWCW plants) 20% CW 0.2 q With random mating, these gametes will result in the same mix of genotypes in the next generation: 64% CRCR,32% CRCW,and4% CWCWplants
CRCR CWCW CRCR CRCR CRCR CRCW CRCW 5 plants leave offspring CRCR CRCR 2 plants leave offspring CRCR CRCR CRCR CWCW CWCW CRCR CRCW CRCW CRCR CRCR CRCR CWCW CRCR CRCR CRCW CRCR CRCW CRCW CRCR CRCW CRCR Generation 1 Generation 2 Generation 3 p 0.5 q 0.5 p 1.0 q 0.0 p (frequency of CR) 0.7 q (frequency of CW) 0.3
Original population Surviving population Bottlenecking event (a) By chance, blue marbles are overrepresented in the surviving population. (b) Florida panther (Puma concolor coryi)
Post-bottleneck (Illinois, 1993) Pre-bottleneck (Illinois, 1820) Greater prairie chicken Range of greater prairie chicken (a) Number of alleles per locus Percentage of eggs hatched Population size Location Illinois 1930–1960s 1993 1,000–25,000 50 93 50 5.2 3.7 Kansas, 1998 (no bottleneck) 99 750,000 5.8 75,000– 200,000 Nebraska, 1998 (no bottleneck) 5.8 96 (b)
Central population NORTH SEA Eastern population Vlieland, the Netherlands 2 km Population in which the surviving females eventually bred 60 Parus major Central 50 Eastern 40 Survival rate (%) 30 20 10 0 Females born in eastern population Females born in central population
Original population Frequency of individuals Original population Evolved population Phenotypes (fur color) (b) Disruptive selection (c) Stabilizing selection (a) Directional selection
Bones shown in green are movable. Ligament
Experiment Recording of SC male’s call Recording of LC male’s call Female gray tree frog LC male gray tree frog SC male gray tree frog SC sperm Eggs LC sperm Offspring of LC father Offspring of SC father Survival and growth of these half-sibling offspring compared Results
Key Frequencies of the sickle-cell allele 0–2.5% 2.5–5.0% 5.0–7.5% Distribution of malaria caused by Plasmodium falciparum (a parasitic unicellular eukaryote) 7.5–10.0% 10.0–12.5% 12.5%
“Left-mouthed” P. microlepis 1.0 “Right-mouthed” P. microlepis Frequency of “left-mouthed” individuals 0.5 0 ’85 ’87 ’89 1981 ’83 Sample year