Download
1 / 1
10 likes | 106 Views
Conclusion. Numerical Analysis of Flow and Mixing Phenomena of Municipal Solid Waste Particles on a Reverse Acting Grate. Residence Time Distributions - F and C Diagram – with Different Particle Size. Mixing Diffusion Coefficients, De.

E N D
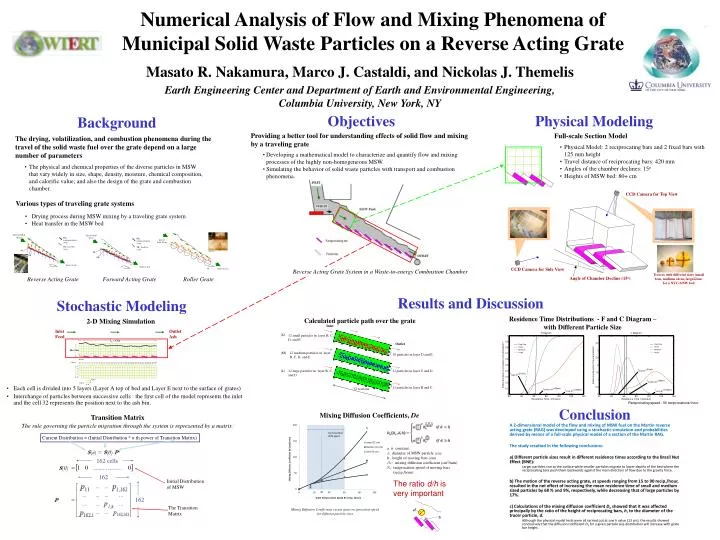
Conclusion Numerical Analysis of Flow and Mixing Phenomena of Municipal Solid Waste Particles on a Reverse Acting Grate ResidenceTime Distributions - F and C Diagram – with Different Particle Size Mixing Diffusion Coefficients, De A 2-dimensional model of the flow and mixing of MSW fuel on the Martin reverse acting grate (RAG) was developed using a stochastic simulation and probabilities derived by means of a full-scale physical model of a section of the Martin RAG. The study resulted in the following conclusions: a) Different particle sizes result in different residence times according to the Brazil Nut Effect (BNE): Larger particles rise to the surface while smaller particles migrate to lower depths of the bed where the reciprocating bars push them backwards against the main direction of flow due to the gravity force. b) The motion of the reverse acting grate, at speeds ranging from 15 to 90 recip./hour, resulted in the net effect of increasing the mean residence time of small and medium sized particles by 68 % and 9%, respectively, while decreasing that of large particles by 17%. c) Calculations of the mixing diffusion coefficient De showed that it was affected principally by the ratio of the height of reciprocating bars, h, to the diameter of the tracer particle, d. Although the physical model tests were all carried out at one h value (13 cm), the results showed conclusively that the diffusion coefficient De for a given particle size distribution will increase with grate bar height. Calculated particle path over the grate Plug Flow Inlet Plug Flow Small Small Medium Medium (S) a, b: constant d: diameter of MSW particle (cm) h: height of moving bars (cm) De : mixing diffusion coefficient (cm2/min) Rr: reciprocation speed of moving bars (recip./hour) 12 small particles in layer B, C, D, and E Large Large Outlet Reciprocating speed : 90 reciprocations/ hour Masato R. Nakamura, Marco J. Castaldi, and Nickolas J. Themelis Earth Engineering Center and Department of Earth and Environmental Engineering, Columbia University, New York, NY (M) 12 medium particles in layer B, C, D, and E 10 particles in layer D and E The ratio d/h is very important (L) 12 large particles in layer B, C, and D 11 particles in layer C and D 11 particles in layer B and C 32 sections Mixing Diffusion Coefficients versus grate reciprocation speed for different particle sizes d Objectives Physical Modeling Background h Full-scale Section Model Providing a better tool for understanding effects of solid flow and mixing by a traveling grate The drying, volatilization, and combustion phenomena during the travel of the solid waste fuel over the grate depend on a large number of parameters • Physical Model: 2 reciprocating bars and 2 fixed bars with 125 mm height • Travel distance of reciprocating bars: 420 mm • Angles of the chamber declines: 15o • Heights of MSW bed: 80+ cm • Developing a mathematical model to characterize and quantify flow and mixing processes of the highly non-homogeneous MSW. • Simulating the behavior of solid waste particles with transport and combustion phenomena. • The physical and chemical properties of the diverse particles in MSW that vary widely in size, shape, density, moisture, chemical composition, and calorific value; and also the design of the grate and combustion chamber. CCD Camera for Top View Various types of traveling grate systems • Drying process during MSW mixing by a traveling grate system • Heat transfer in the MSW bed Inlet of Solid Waste Inlet of Solid Waste RBn: reciprocating bar (step) RBn: reciprocating bar (step) Inlet of Solid Waste FBn: fixed bar (step) FBn: fixed bar (step) FB1 FB1 RB1 RB1 26o Outlet of Ash 30 Outlet of Ash CCD Camera for Side View 30o Outlet of Ash Reverse Acting Grate System in a Waste-to-energy Combustion Chamber Tracers with different sizes (small 6cm, medium 14cm, large22cm) for a NYC-MSW bed Reverse Acting Grate Forward Acting Grate Roller Grate Angle of Chamber Decline (15o) Resultsand Discussion Stochastic Modeling 2-D Mixing Simulation Inlet Feed Outlet Ash Lg = 6.5m H=1.0m 32 zones 5 layers 0.20 m 0.20 m • Each cell is divided into 5 layers (Layer A top of bed and Layer E next to the surface of grates) • Interchange of particles between successive cells : the first cell of the model represents the inlet and the cell 32 represents the position next to the ash bin. Transition Matrix The rule governing the particle migration through the system is represented by a matrix: Current Distribution = (Initial Distribution * n th power of Transition Matrix) S(n) = S(0) Pn 162 cells S(0) 162 Initial Distribution of MSW 162 P The Transition Matrix