Download
1 / 36
390 likes | 697 Views
CH 2. The Mobile Radio Environments and Diversity Techniques. Contents. Link Analysis Path Loss Models Fading in Mobile Cellular Environments Long-term Fading Short-term Fading Fading Signal Generation: Jakes’ Model Time Dispersion of Signal due to Fading

E N D
CH 2. The Mobile Radio Environments and Diversity Techniques
Contents • Link Analysis • Path Loss Models • Fading in Mobile Cellular Environments • Long-term Fading • Short-term Fading • Fading Signal Generation: Jakes’ Model • Time Dispersion of Signal due to Fading • Frequency Domain Effect of Time Dispersion • Diversity Techniques
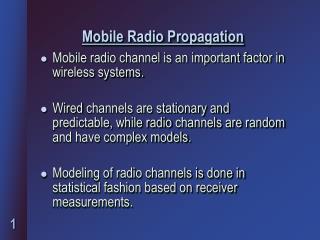
Link Analysis [1] • Link analysis or Link budget analysis? • The carrier-to-noise ratio (CNR) is the parameter of most interest in the link analysis of communication systems, along with signal-to-noise ratio (SNR). • Link budget: Detailed description on gain or loss of the CNR (or SNR) at each part of the communication link • Link equation ERP: effective radiated power at antenna, Pt: power at the output of the transmit power amplifier, Lc: cable loss, Gt: transmit antenna gain Gr: receive antenna gain, Lp: propagation loss, N: noise power at receiver • Instead of the CNR or SNR, the bit-energy-to-noisespectral density ratio,Eb/No, is also used in the link analysis of digital communication systems.
Path Loss Models: Free-Space Model [1],[2] • Friss Equation: the relationship between the transmit and receive powers in free space Pr(d): receive power, d: distance, Pt: transmit power, Gt: transmit antenna gain Gr: receive antenna gain, l: wavelength, path loss exponent = 2 • The free-space propagation loss in linear scale is • Using fl =c, where c is the speed of light, the free-space loss in log-scale is d:distance(km), f:carrier frequency (MHz) • The free space model is mostly used in satellite or deep-space communications.
Path Loss Models: Lee Model [1],[2] • The propagation loss in cellular environments is much higher than the free-space loss due to the obstacles between the base station and the mobile station. • The simplified formula developed by W. C. Y. Lee in cellular environments is d: distance (km) between the base station and the mobile station hb: height (m) of the base station antenna, path loss exponent = 3.84 • In log-scale, we have path loss slope = - 38.4dB/decade • The generalized form of the Lee model is much more complicated and is quite useful in the link analysis for terrestrial environments.
Path Loss Models: Hata Model [1],[2] • The Hata model is based on extensive field measurements in urban environments and is valid for 150MHz~1500MHz. f: carrier frequency (MHz), hb: antenna height of the base station (m) hm: mobile antenna height (m), d: distance (km) • The parameters a(hm) and Ko are used to account for mobile environments. • There are certain ranges in which the model is valid, that is, • Note that the path loss slope is
Path Loss Models : Observations [1] Fig. 2.1 Comparison of path losses for urban scenarios (hb=30m, fc=881.5MHz, hm=1.5m).
Path Loss Models: COST231- Hata Model [1],[2] • The COST231-Hata model is an extension of the Hata model for 1500 ~ 2000 MHz range where most PCS systems may operate. • The path loss in the COST231-Hata model is d: distance (km), f: carrier frequency (MHz), hb: BS antenna height (m) hm: MS antenna height (m), : the same as the Hata model • The COST231-Hata model can also be used only in case where
Fading in Mobile Cellular Environments [1]-[3] • The phenomenon of a signal strength fluctuation due to the obstacles between the transmitter and receiver is called fading. Fig. 2.2 An example of mobile cellular environments.
Fading in Mobile Cellular Environments (cont.) • Thefadingis classified into long-term fading and short-term fading,and the signal strength r(t) can be expressed as the product of long-term fading and short-term fading components: Fig. 2.3 Radio signal strength in fading environments.
Long-term Fading: Shadowing Effect • The local mean of the signal strength, rL(t), is a random process caused by shadowing effect due to large obstacles such as buildings and hills, etc. • The slow and large fluctuation of the local mean is called the long-term fading. • Empirical studies have shown that the local mean has the log-normal distribution such that rL,dB=10log10rL, s: standard deviation of rL,dB, m: mean of rL,dB • The standard deviation s of the local mean in a cellular environment is typically around 8dB.
Short-term Fading: Rayleigh Fading • The signal fluctuation due to the multi-path signals reflected from the obstacles around the receiver is called short-term fading or multi-path fading. • Two representative short-term fadings: Rayleigh fading and Rician fading • When there is no direct path, received signals are made up of a group of reflections from obstacles and none of the reflected paths is dominant. • The reflected signals arrive at slightly different times, with different amplitudes, and with different phases. • In this case, the envelope of a received signal is Rayleigh distributed. • Assuming the number of mutipaths is N, the composite signal at the receiver is An, fc: amplitude and carrier frequency, fD,n: Doppler shift of n-th path signal given by with v and qn denoting the mobile speed and angle between mobile and signal.
Short-term Fading : Rayleigh Fading (cont.) • The in-phase and quadrature phase representation of the received signal is where • The terms in the summations of the above equations can be assumed independent random processes. If N is large, both rI(t) and rQ(t) become independent zero-mean Gaussian random processes by the central limit theorem. • Therefore, the signal envelope has a Rayleigh distribution with the pdf of where
Short-term Fading: Rayleigh Fading (cont.) • In case where there are many scattered waves coming from all directions, the signal fluctuation repeats every half wavelength of the carrier, that is, the fading rate corresponds to half wavelengths. Fig. 2.4 An example to illustrate the fading rate at the mobile station.
Short-term Fading: Rayleigh Fading (cont.) Fig. 2.5 Rayleigh fading signal at mobile for v = 100km/h and f =1960MHz.
Short-term Fading: Rayleigh Fading (cont.) • In mobile communication environments, the Doppler spectrum of the carrier signal follows the Clarke’s model, as shown in Fig. 2.6. Sc(f) Fig. 2.6 Doppler spectrum for a mobile in Rayleigh fading environments.
Short-term Fading: Rayleigh Fading (cont.) • Example • Assume that we use a carrier frequency of 900 MHz for cellular and 1.9 GHz for PCS, and that the vehicle speed is 25 m/sec. • Compare the fading rate at mobile between cellular and PCS signals, and find the maximum Doppler frequencies. The wavelengths are The time for a mobile to travel from one fade to the next fade is
Short-term Fading: Rayleigh Fading (cont.) • Therefore, the fading rates are 150 Hz for cellular and 317 Hz for PCS, respectively. • The maximum Doppler frequencies are
Short-term Fading: Rician Fading [2],[4] • For a multi-path fading channel containing direct components,rI(t) and rQ(t) have non-zero mean, and the signal envelope has a Rician distribution, i.e., [4] s2: power of a direct component, s2: variance of the in-phase or quadrature phase component, Io: modified 0th-order Bessel function, total power of indirect components: 2s2 • K=s2/(2s2) is the Rice factor or the Rician K-factor. When K=0, the channel exhibits Rayleigh fading, while when K approaches to infinity, there becomes no fading. • The Rician fading is often observed in micro-cell,indoor environments, or satellite communications.
Fading Signal Generation: Jakes’ Model [4] • Jakes’ model is a very effective channel simulator that generates Rayleigh or Rician fading signals by using a number of virtual oscillators. • Assuming an isotropic scattering channel with N multi-path signals of equal strength, the complex fading signal r(t) can be expressed as [4] where M: number of oscillators, N: number of multi-paths, M=(N/2-1)/2 v: mobile speed, l: signal wavelength. • Rician fading signals can be generated easily by adding direct components to Rayleigh fading signals.
Fading Signal Generation: Jakes’ Model (cont.) • Jakes’ model can be extended to provide up to M independent fading signals by simply giving the additional phase shift to each oscillator, that is, where
Time Dispersion of Signal due to Fading [2] • In cellular environments, multi-paths arrive at different times, which results in the time dispersion of a received signal. • In usual, the signal strength of a received signal is modeled to decay exponentially as a function of the time delay; Pk: power of kth path, trms: time delay of kth signal, trms: rms delay C: constant Fig. 2.7 Time dispersion of signal. Fig. 2.8 Multipath delay profile.
Time Dispersion of Signal due to Fading (cont.) [2] • There are several parameters to characterize the time dispersive properties of fading channels; that is, mean excess delay,rms delay spread (or delay spread), etc. • The mean excess delay is the first moment of the power delay profile and is defined as • The rms delay spread (or delay spread) is the square root of the second central moment of the power delay profile and is defined as
Time Dispersion of Signal due to Fading (cont.) • Example • Compute the mean excess delay and rms delay spread for the multipath delay profile given in the figure below. • Determine if the delay profile will cause ISI (inter-symbol interference) to a mobile communication system using 50 Kbps as its data rate. Fig. 2.9 Multipath delay profile.
Time Dispersion of Signal due to Fading (cont.) Since the bit duration is significantly larger than the rms delay spread, a serious ISI may not occur.
Time Dispersion of Signal due to Fading (cont.) • Example • Determine if the delay profile shown in Fig. 2.9 will cause ISI to a mobile communication system using 1.2288 Mbps as its data rate. Since in this case the delay spread is so much more than the bit duration, a serious ISI would normally occur if the system is a TDMA system. • However, if the system is a CDMA system such as the IS-95 or WCDMA, there is no significant ISI since the CDMA system uses a special form of diversity called path diversity to recover the signal using a rake receiver.
Time Dispersion of Signal due to Fading (cont.) [2] Table 2.1 Typical measured values of rmsdelay spread[2].
Frequency Domain Effect of Time Dispersion [1] • We now examine the effect of time dispersion in the frequency domain. • To this end, we assume that there are two multi-paths as shown in Fig. 2.10. Fig. 2.10 Two multi-path signals separated by time t.
Frequency Domain Effect of Time Dispersion (cont.) • The received signal is • By taking a Fourier transform, we can obtain where and • The channel response is illustrated in Fig. 2.11.
Frequency Domain Effect of Time Dispersion (cont.) Narrowband signal Frequency-Nonselective Wideband signal Frequency-Selective Fig. 2.11 The channel response as a function of frequency.
Frequency Domain Effect of Time Dispersion (cont.) • In case where the signal bandwidth is significantly smaller than the inverse of delay spread, the signal is said to suffer from frequency-nonselective fading or flat fading. ==> There is no serious inter-symbol interference (ISI). • On the contrary, if the signal bandwidth is greater than the inverse of delay spread, the signal is said to suffer from frequency-selective fading. ==> There is a serious ISI in TDMA systems. • The BER performance of a TDMA system in frequency-selective fading environments is significantly worse than that in frequency-nonselective fading environments due to inter-symbol interference. • In CDMA systems, however, the BER performance in frequency-selective fading environments can be better than that in frequency-nonselective fading environments due to path diversity.
Diversity Techniques [2],[5] • In mobile communication environments, a received signal sometimes suffers from severe impairments due to fading. • Diversity technique(or diversity combining schemes) is a popular approach to reduce the effects of fading and to improve the reliability of communications using the diversity of communication channel. • There are several types of diversity that can be used for mobile communication systems; • Time diversity: repetition / interleaving / combining • Frequency diversity: wideband signal ==> path diversity: multi-path signals • Space diversity: multiple antennas at base station (antenna diversity), handoff • Polarization diversity: polarized antennas, etc. • There are three diversity combining schemes; selection diversity, maximal-ratio combining, and equal-gain combining schemes.
Diversity Techniques: Selection Diversity [5] Fig. 2.12. Selection diversity receiver model.
Diversity Techniques: Maximal-Ratio Combining [5] • Assume that all branch signals are combined such that ai, ji: fading envelope and phase of the i-th path signal, s(t) : transmit signal ni(t): complex noise process, M: number of branches • It can be proven that the maximum SNR at the combiner output is obtained at • That is, in a maximal-ratio combiner, each branch signal is weighted proportional to the magnitude of each branch signal together with phase compensation. • The SNR at the combiner output equals the sum of the SNR of all branches.
Diversity Techniques: Equal-Gain Combining [5] • In equal-gain combiner, the magnitudes of branch weights are all the same. • The output signal is simply given by where • The performance of the three combining schemes is the better in the order of the maximal-ratio combining, equal-gain combining, and selection diversity.
References • Samuel C. Yang, CDMA RF System Engineering, Artech House, 1998. • Theodore S. Rappaport, Wireless Communications, 2nd Ed., Prentice Hall, 2002. • Gordon L. Stuber, Principle of Mobile Communication, 2nd Ed., Kluwer Academic Publishers, 2001. • John G. Proakis, Digital Communications, 4th Ed., McGraw Hill, 2001. • V. K. Garg, IS-95 CDMA and cdma2000, Prentice Hall, 2001.