Download
1 / 18
190 likes | 325 Views
1. Estimation. ESTIMATION. Sampling Distribution (a.k.a. “Distribution of Sample Outcomes ”). Based on the laws of probability “OUTCOMES” = proportions, means, etc. Infinite number of random samples all possible sample outcomes And the probability of obtaining each one

E N D
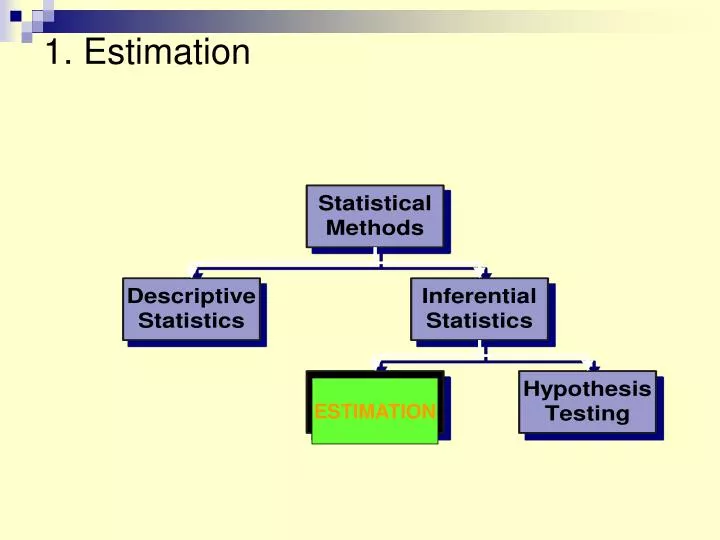
1. Estimation ESTIMATION
Sampling Distribution(a.k.a. “Distribution of Sample Outcomes”) • Based on the laws of probability • “OUTCOMES” = proportions, means, etc. • Infinite number of random samples all possible sample outcomes • And the probability of obtaining each one • Allows us to estimate: • What is the likelihood of obtaining our particular sample outcome? • Or, “There is a X% chance that the true population parameter is within +/- some distance from this sample outcome.
ESTIMATION • To estimate (make an “inference”) population parameters from sample statistics • Why Necessary? • Most commonly used for polling data • Point estimate • Confidence intervals
Estimation1 : Pick Confidence Level • Confidence LEVEL • Probability that the unknown population parameter falls within the confidence interval • Confidence level = 1 - • Alpha () is the probability that the parameter is NOT within the interval
Divide the probability of error () equally into the upper and lower tails of the distribution For 95% confidence level, ( = .05) the area under curve must equal 5%. The corresponding Z score for this is 1.96. Estimation 2: Find Appropriate Z-score 0.95 Sampling Distribution .025 .025 -1.96 1.96 Z scores
Estimation 3 : Constructing an Interval Estimate • What is your point estimate? • How many “standard errors” do you want to go out (on sampling distribution) from this point estimate? • What is a particular standard error “worth” for our sample outcome? • Takes into account sample size (N) and dispersion/heterogeneity • For proportions, the p (1-p) part of the equation
Constructing a Confidence Interval for Proportions • What is your point estimate? proportion • How many “standard errors” do you want to go out from this point estimate? • 1.65 Standard Errors alpha of .10 (Confidence level of 90%) • 1.96 Standard Errors alpha of .05 (Confidence level of 95%) • 2.58 Standard Errors alpha of .01 (Confidence level of 99%) • What is a particular standard error “worth” for out sample outcome? Everything after the “z” in formula 7.3 in Healey book • Numerator = (your proportion) (1- proportion) • Generic = .50 .25 in numerator
Estimation of Population Means • EXAMPLE: A researcher has gathered information from a random sample of 178 households in Duluth. Construct a confidence interval to estimate the population mean at the 95% level: • An average of 2.3 people reside in each household. Standard deviation is .35.
Constructing a Confidence Interval for Means • What is your point estimate? mean • How many “standard errors” do you want to go out from this point estimate? • 1.96 Standard Errors alpha of .05 • 2.58 Standard Errors alpha of .01 • What is a particular standard error “worth” for out sample outcome? s/√N-1 • We don’t know the population standard deviation (σ) so we substitute our best guess • BUT, we subtract one to “correct” for bias
Application to Example • What is your point estimate? 2.3 people per household • How many “standard errors” do you want to go out from this point estimate? • 1.96 Standard Errors alpha of .05 • What is a particular standard error “worth” for out sample outcome? .35 /√178-1 • Formula • c.i.95% = z +/- (s/√N-1) = 1.96 (.35 /√178-1) = .0515 • 95% sure that over the long run, the average number of people in Duluth households (THE WHOLE POPULATION) is between 2.25 and 2.35.
In groups, construct confidence intervals for the following means • A random sample of 429 college students was interviewed • They reported they had spent an average of $178 on textbooks during the previous semester. If the standard deviation (s) of these data is $15 construct an estimate of the population at the 95% confidence level. • They reported they had missed 2.8 days of class per semester because of illness. If the sample standard deviation is 1.0, construct an estimate of the population mean at the 99% confidence level. • Two individuals are running for mayor of Duluth. You conduct an election survey of 100 adult Duluth residents 1 week before the election and find that 45% of the sample support candidate Long Duck Dong, while 40% plan to vote for candidate Singalingdon. • Using a 95% confidence level, based on your findings, can you predict a winner?
Review: What influences confidence intervals? • The width of a confidence interval depends on three things • : The confidence level can be raised (e.g., to 99%) or lowered (e.g., to 90%) • N: We have more confidence in larger sample sizes so as N increases, the interval decreases • Variation: more variation = more error • For proportions, % agree closer to 50% • For means, higher standard deviations
Hypothesis Testing (intro) HYPOTHESIS TESTING Estimation
Hypothesis Testing • Hypothesis (Causal) • A prediction about the relationship between 2 variables that asserts that changes in the measure of an independent variable will correspond to changes in the measure of a dependent variable • Hypothesis testing • Is the hypothesis supported by facts (empirical data)
Hypothesis Testing & Statistical Inference • We almost always test hypotheses using sample data • Also referred to as “significance testing” • Draw conclusions about the population based on sample statistics • As a result, have to account for sampling error when testing hypotheses • Is there a “statistically significant” finding
Research vs. Null hypotheses • Research hypothesis • H1 • Typically predicts relationships or “differences” • Null hypothesis • Ho • Predicts “no relationship” or “no difference” • Can usually create by inserting “not” into a correctly worded research hypothesis • In Science, we test the null hypothesis!
DIRECTIONAL VS. NONDIRECTIONAL HYPOTHESES • Non-directional research hypothesis • “There was an effect” • “There is a difference” • Directional research hypothesis • Specifies the direction of the difference (greater or smaller) from the Ho • GROUP WORK
Testing a hypothesis 101 • State the null & research hypotheses • Set the criteria for a decision • Alpha, critical regions for particular test statistic • Compute a “test statistic” • Make a decision • REJECT OR FAIL TO REJECT the null hypothesis • We cannot “prove” the null hypothesis (always some non-zero chance we are incorrect)