Download
1 / 56
560 likes | 707 Views
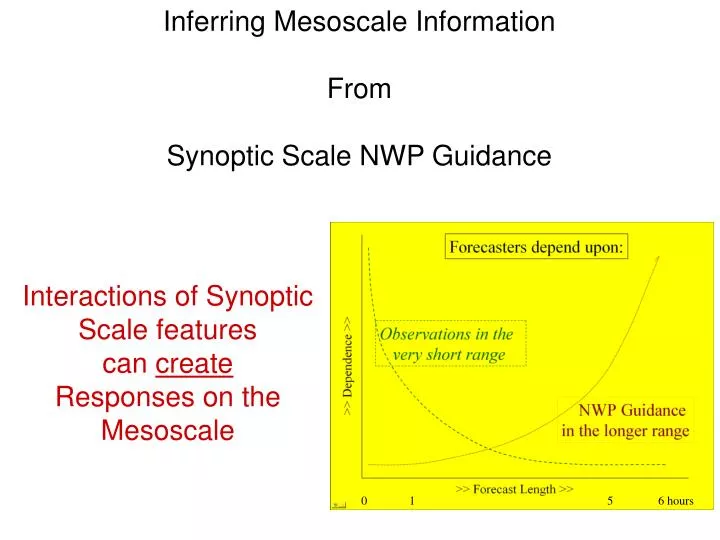
Inferring Mesoscale Information From Synoptic Scale NWP Guidance. Interactions of Synoptic Scale features can create Responses on the Mesoscale. 0 1 5 6 hours. What are we looking for?

E N D
Inferring Mesoscale Information From Synoptic Scale NWP Guidance Interactions of Synoptic Scale features can create Responses on the Mesoscale 0 1 5 6 hours
What are we looking for? 1 – An environment that is already conducive to (will support) thunderstorm growth Remember, Convective Parameterizations do NOT predict realistic convection patterns
What are we looking for? 1 – An environment that is already conducive to (will support) thunderstorm growth Classic Severe Thunderstorm Sounding
What are we looking for? • 1 – Environments that are already conducive to (will support) thunderstorm growth • Or • 2 - Synoptic flow patterns that will produce this kind of environment in the near future • Need to develop (for thunderstorms): • Abundant low level moisture • A capping inversion (to prevent convection from forming too early) • Dry air at middle levels • Diurnal heating • Development of Low-level lift • Development of Upper-level divergence • For heavy precipitation - add a continuous supply of additional low-level moisture • For strong winds – a continuous supply of mid-level dryness
The US NWS has developed ‘check lists’ for use in various parts of the country
How do we find What are we looking for? • 1 – Environments that are already conducive to (will support) thunderstorm growth • Does the NWP guidance already have the signatures that we need? • Look at model soundings and their evolution, but . . . • Remember that if the Convective Parameterization in the model has been triggered • the atmospheric stability was becoming too weak, the model will • stabilize and 2) moisten the sounding. • Check to see if the model is producing convective precipitation
Model Soundings show important information in addition to Temperature, Moisture and Wind Profiles, including surface and multi-level stability parameters (In severe weather situations, Model Soundings will typically underestimate strengths of inversions (temp and moisture), wind shears (vertical and horizontal), . . .
What are we looking for? • 1 – Environments that are already conducive to (will support) thunderstorm growth • Or • 2 - Synoptic flow patterns that will produce this kind of environment in the near future • (even if the models don’t depict correct it at small enough scales) • Need to develop (for thunderstorms): • Abundant low level moisture • (Model may make area of moisture too wide and moist high enough)
Display of low-level moisture (mixing ratio, g/kg), winds and surface topography, with high amounts of moisture highlighted. Plot done for 850 hPa layer of model – good for mean moisture in low levels
Display of low-level moisture (mixing ratio, g/kg), winds and surface topography, with high amounts of moisture highlighted. Plot done for bottom-most 30-hPa deep layer of model to capture near-surface moisture sources - good in areas affected by sloping terrain
What are we looking for? • 1 – Environments that are already conducive to (will support) thunderstorm growth • Or • 2 - Synoptic flow patterns that will produce this kind of environment in the near future • Need to develop (for thunderstorms): • Abundant low level moisture • Another measure of the total thermal energy in Equivalent Potential Temperature • E • which combines: • the temperature of a parcel of air and the total latent heat present in the parcel
Display of low-level Equivalent Potential Temperature (C), winds and surface topography, with high E highlighted. Plot done for bottom-most 30-hPa deep layer of model to capture near-surface moisture sources - good in areas affected by sloping terrain
What are we looking for? • 1 – Environments that are already conducive to (will support) thunderstorm growth • Or • 2 - Synoptic flow patterns that will produce this kind of environment in the near future • Need to develop (for thunderstorms): • Abundant low level moisture • A capping inversion (to prevent convection from forming too early) • (Model will probably underestimate strength of both temperature and moisture inversions) Diagnosed either from model sounding at a point Or By looking at the difference in Temperature from 850 to 700 (or 600) hPa Or By looking at the difference in Potential Temperature from 850 to 700 (or 600) hPa
Display of Temperature difference between 850 and 700 hPa Lower values indicate more stable Lapse Rates, since temperature normally decreases with height
Display of Potential Temperature difference between 850 and 700 hPa Lower values indicate more stable Lapse Rates, since potential temperature always increases with height
What are we looking for? • 1 – Environments that are already conducive to (will support) thunderstorm growth • Or • 2 - Synoptic flow patterns that will produce this kind of environment in the near future • Need to develop (for thunderstorms): • Abundant low level moisture • A capping inversion (to prevent convection from forming too early) • Dry/cold air at middle levels + High tropopause • (Model may underestimate extreme dry values and smooth out horizontal gradients)
Display of Tropopause Pressure (hPa) Lower values indicate potential for deeper storm growth
Display of 600 hPa mixing ratio (green, g/kg), Winds (blue) and Mixing Ratio difference between 600 and 850 hPa (<-10 g/kg – dashed white) Lower values indicate greater drying between lower to upper levels
Display of 600 hPa Equivalent Potential Temperature difference between 600 and the layer 30 hPa above the ground (C) Larger values (highlighted) indicate greater drying from lower to upper levels
Vertical circulations ahead and behind a propagating Jet Streak can produce localized upper-level convergence and produce drying by subsidence below the jet level. Contributes both to mid-level drying and warming needed to create ‘capping inversion’
Southern Hemisphere Ideal Jet Parcels leaving Jet Streak decelerate and move toward higher heights Parcels entering Jet Streak accelerate and move toward lower heights
Entrance RegionThermally Direct Circulation Warm air rises Cold air sinks
Exit RegionThermally Indirect Circulation Cold air rises Warm air sinks
Vertical circulations ahead and behind a propagating Jet Streak can produce localized upper-level convergence and Subsidence of dry air below the jet level. Contributes both to mid-level drying and ‘capping inversion’ Entrance Region Divergence J Convergence Convergence Exit Region Divergence
As a Jet Streak moves past a point (X) that was originally below the left exit region, It transitions from a thermally direct regime of upper-level convergence and subsidence of dry air which supports the “capping inversion” or “Lid” to A dynamically forced, thermally indirect regime with upper-level divergence, which forces low-level convergence and lifting of the column of air X X
Convective Available Potential Energy (CAPE) is a measure of parcel buoyancy, while Convective INhabition (CIN) is a measure of “Lid” strength CAPE CIN
What are we looking for? • 1 – Environments that are already conducive to (will support) thunderstorm growth • Or • 2 - Synoptic flow patterns that will produce this kind of environment in the near future • Need to develop (for thunderstorms): • Abundant low level moisture • A capping inversion (to prevent convection from forming too early) • Dry air at middle levels • Diurnal heating • (Model may under- or overestimate daily temperature range do to • incorrect clouds, soil moisture, vegetation, . . . )
Display of near surface Temperature difference between 00 and 12 UTC Larger values highlighted Beware – incorrect clouds or precipitation in model can cause surface temperature to be too cool!!!
Display of near surface Temperature difference between 00 and 12 UTC Larger values highlighted Beware – incorrect clouds or precipitation in model can cause surface temperature to be too cool!!!
What are we looking for? • 1 – Environments that are already conducive to (will support) thunderstorm growth • Or • 2 - Synoptic flow patterns that will produce this kind of environment in the near future • Need to develop (for thunderstorms): • Abundant low level moisture • A capping inversion (to prevent convection from forming too early) • Dry air at middle levels • Diurnal heating • Development of Low-level lift
Development of Low-Level Lifting Here’s where things get interesting Remember, we are NOT ONLY looking for areas where the model has forecast rain, but also Areas where convection is likely to occur
Development of Low-Level Lifting Here’s where things get interesting Options: Model low-level Vertical Motion Can be affected by model precipitation fields – are they correct?
Development of Low-Level Lifting Here’s where things get interesting Options: Model low-level Vertical Motion Can be affected by model precipitation fields – are they correct?
Development of Low-Level Lifting Here’s where things get interesting Options: Model low-level Convergence Can be affected by model precipitation fields – are they correct?
Development of Low-Level Lifting Here’s where things get interesting Options: Model low-level cyclonic circulations/vorticity Not affected as much by model precipitation fields
Development of Low-Level Lifting Here’s where things get interesting Options: Orographic lifting diagnosed from model (upslope) Calculate uplift using low level wind (above friction layer) and surface topography
Development of Low-Level Lifting Here’s where things get interesting Options: Model low-level Vertical Motion Small-scale cyclonic circulations and short waves Orographic lifting diagnosed from model (upslope) In bands head of and parallel to cold fronts Right-exit or left-entrance region of jet streak Along outflow boundaries of previous convection Along “sea breeze” fronts (likely to extend MUCH too far inland) Water / Land Wet Soil / Dry Soil In afternoon between areas that had been cloudy (foggy) and clear in morning Gravity Waves, . . . Jet Streak Exit Region Jet Streak Entrance Region
What are we looking for? • 1 – Environments that are already conducive to (will support) thunderstorm growth • Or • 2 - Synoptic flow patterns that will produce this kind of environment in the near future • Need to develop (for thunderstorms): • Abundant low level moisture • A capping inversion (to prevent convection from forming too early) • Dry air at middle levels • Diurnal heating • Development of Low-level lift • Development of Upper-level divergence • (Model may underestimate wind maxima, • wind shears (especially on equator-ward (left) side of jet), ageostropic circulations, . . .)
Vertical circulations ahead and behind a propagating Jet Streak can produce localized upper-level convergence and Subsidence of dry air below the jet level. Contributes both to mid-level drying and ‘capping inversion’ Entrance Region Divergence J Convergence Convergence Exit Region Divergence
What are we looking for? • 1 – Environments that are already conducive to (will support) thunderstorm growth • Or • 2 - Synoptic flow patterns that will produce this kind of environment in the near future • Need to develop (for thunderstorms): • Abundant low level moisture • A capping inversion (to prevent convection from forming too early) • Dry air at middle levels • Diurnal heating • Development of Low-level lift • Development of Upper-level divergence • For heavy precipitation - add a continuous supply of additional low-level moisture
What are we looking for? • For heavy precipitation - add a continuous supply of additional low-level moisture • Combine low-level mixing ratio and wind field
What are we looking for? • For heavy precipitation - add a continuous supply of additional low-level moisture • Combine low-level mixing ratio and wind field • to determine Moisture Flux
What are we looking for? • For heavy precipitation - add a continuous supply of additional low-level moisture • Combine low-level mixing ratio and wind field • to determine Moisture Flux and Moisture Flux Convergence (at small scale)
What are we looking for? • 1 – Environments that are already conducive to (will support) thunderstorm growth • Or • 2 - Synoptic flow patterns that will produce this kind of environment in the near future • Need to develop (for thunderstorms): • Abundant low level moisture • A capping inversion (to prevent convection from forming too early) • Dry air at middle levels • Diurnal heating • Development of Low-level lift • Development of Upper-level divergence • For heavy precipitation - add a continuous supply of additional low-level moisture • For strong winds – add a continuous supply of mid-level dryness
What are we looking for? • For strong winds – add a continuous supply of mid-level dryness • Combine mid-level mixing ratio and wind field • to determine moisture (dryness) advection
Summary of factors for diagnosing Severe Storms Surface Hourly surface mesoscale analysis is critical in severe forecasting and necessary to monitor model accuracy. Detailed analysis can uncover features such as boundaries, mesolows, bubble highs, strong pressure falls, and moisture pooling. Optimal surface features for severe weather include: · Dew Points 18°C · Theta E ridge and positive Theta-E advection · Low-level moisture flux convergence · Thermal ridge over or west of the moisture axis · Areas experiencing strong temperature and dew point rises · Rapidly developing cumulus congestus within areas · Areas reaching convective temperature · Focusing mechanisms (fronts, troughs, gust fronts, dry lines, outflow boundaries, etc.) · Surface pressure 1005 mb · Areas with concentrated pressure falls of 5 mb over 12 hours.
Aloft Forecasters should start with a 4-dimensional mental picture of the atmosphere (Doswell, 1982). Upper air and surface maps can and should be enhanced to emphasize features of importance to convective storm forecasting (Maddox, 1979b). Optimum upper air features for severe weather include: 1. 925 mb (near surface) · Areas under and just west of the low level jet (winds 25 kts) · Thermal ridge west of moisture axis · Significant warm air advection · Strong moisture flux convergence · Focusing mechanisms (fronts, troughs, and dry lines) 2. 850 mb (above surface) · Areas under and just west of the low level jet (winds 35 kts) or on the nose of the jet · Thermal ridge west of moisture axis · Dew Point 8°C · Significant warm air advection · The greater the angle of the winds from dry to moist air, the greater the instability. · Strong moisture flux convergence · Focusing mechanisms (fronts and troughs) · Moisture transport axis


![Global scale [> 20000 km] Synoptic scale [2000–20000 km] Mesoscale [2-2000 km] Microscale](https://cdn1.slideserve.com/3357411/slide1-dt.jpg)