Download
1 / 1
10 likes | 147 Views
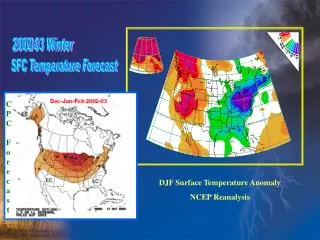
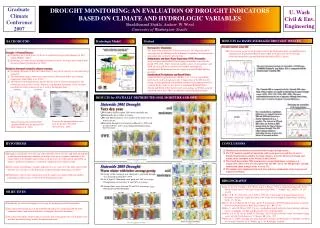
Towards a Near Real Time Drought monitoring based on NCEP Regional Reanalysis Muthuvel Chelliah, Kingtse Mo and Wayne Higgins Climate Prediction Center, NCEP/NWS/NOAA. PE from Palmer and RR. PDSI (RR)

E N D
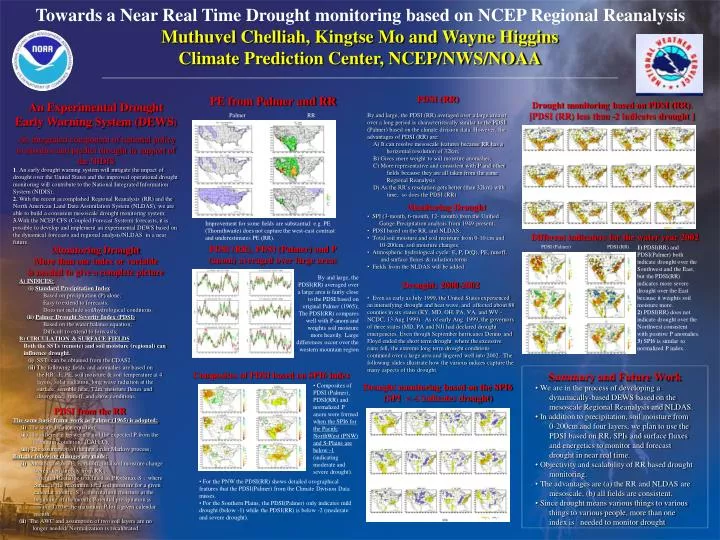
Towards a Near Real Time Drought monitoring based on NCEP Regional Reanalysis Muthuvel Chelliah, Kingtse Mo and Wayne Higgins Climate Prediction Center, NCEP/NWS/NOAA PE from Palmer and RR PDSI (RR) By and large, the PDSI (RR) averaged over a large area or over a long period is characteristically similar to the PDSI (Palmer) based on the climate division data. However, the advantages of PDSI (RR) are: A) It can resolve mesoscale features because RR has a horizontal resolution of 32km; B) Gives more weight to soil moisture anomalies; C) More representative and consistent with P and other fields because they are all taken from the same Regional Reanalysis. D) As the RR’s resolution gets better (than 32km) with time, so does the PDSI (RR). An Experimental Drought Early Warning System (DEWS) An integrated component of national policy to monitor and predict drought in support of the NIDIS 1. An early drought warning system will mitigate the impact of drought over the United States and the improved operational drought monitoring will contribute to the National Integrated Information System (NIDIS); 2. With the recent accomplished Regional Reanalysis (RR) and the North American Land Data Assimilation System (NLDAS), we are able to build a consistent mesoscale drought monitoring system; 3.With the NCEP CFS (Coupled Forecast System) forecasts, it is possible to develop and implement an experimental DEWS based on the dynamical forecasts and regional analysis/NLDAS in a near future. Drought monitoring based on PDSI (RR). [PDSI (RR) less than -2 indicates drought ] Palmer RR • Monitoring Drought • SPI (3-month, 6-month, 12- month) from the Unified • Gauge Precipitation analysis from 1949-present; • PDSI based on the RR, and NLDAS; • Total soil moisture and soil moisture from 0-10 cm and • 10-200cm, soil moisture changes; • Atmospheric hydrological cycle: E, P, D(Q), PE, runoff, • and surface fluxes & radiation terms. • Fields from the NLDAS will be added Improvement for some fields are substantial: e.g. PE (Thornthwaite) does not capture the west-east contrast and underestimates PE (RR). Different indicators for the water year 2002 Monitoring DroughtMore than one index or variableis needed to give a complete picture A) INDICES: (i)Standard Precipitation Index Based on precipitation (P) alone; Easy to extend to forecasts; Does not include soil/hydrological conditions. (ii)Palmer Drought Severity Index (PDSI) Based on the water balance equation; Difficult to extend to forecasts; B) CIRCULATION & SURFACE FIELDS Both the SSTs (remote) and soil moisture (regional) can influence drought. (i) SSTs can be obtained from the CDAS2. (ii) The following fields and anomalies are based on the RR. E, PE, soil moisture & soil temperature at 4 layers, solar radiation, long wave radiation at the surface, sensible heat, T2m, moisture fluxes and divergence, runoff, and snow conditions. PDSI (RR), PDSI (Palmer) and P (anom) averaged over large areas PDSI (Palmer) PDSI (RR) 1) PDSI(RR) and PDSI(Palmer) both indicate drought over the Southwest and the East, but the PDSI(RR) indicates more severe drought over the East because it weights soil moisture more. 2) PDSI(RR) does not indicate drought over the Northwest consistent with positive P anomalies. 3) SPI6 is similar to normalized P index. By and large, the PDSI(RR) averaged over a large area is fairly close to the PDSI based on original Palmer (1965); The PDSI(RR) compares well with P-anom and weights soil moisture more heavily. Large differences occur over the western mountain region • Drought: 2000-2002 • Even as early as July 1999, the United States experienced an intensifying drought and heat wave, and affected about 88 counties in six states (KY, MD, OH, PA, VA, and WV - NCDC, 13 Aug 1999). As of early Aug. 1999, the governors of three states (MD, PA and NJ) had declared drought emergencies. Even though September hurricanes Dennis and Floyd ended the short term drought where the excessive rains fell, the extreme long term drought conditions continued over a large area and lingered well into 2002. The following slides illustrate how the various indices capture the many aspects of this drought. Composites of PDSI based on SPI6 index • Summary and Future Work • We are in the process of developing a • dynamically-based DEWS based on the • mesoscale Regional Reanalysis and NLDAS. • In addition to precipitation, soil moisture from • 0-200cm and four layers, we plan to use the • PDSI based on RR, SPIs and surface fluxes • and energetics to monitor and forecast • drought in near real time. • Objectivity and scalability of RR based drought • monitoring. • The advantages are (a) the RR and NLDAS are • mesoscale, (b) all fields are consistent. • Since drought means various things to various • things to various people, more than one • index is needed to monitor drought • Composites of PDSI (Palmer), PDSI(RR) and normalized P anom were formed when the SPI6 for the Paciifc NorthWest (PNW) and S-Plains are below -1 (indicating moderate and severe drought). Drought monitoring based on the SPI6(SPI < -1 indicates drought) PDSI from the RR The same basic frame work as Palmer (1965) is adopted: (i) The water balance equation; (ii) The difference between P and the expected P from the maximum conditions (CAFEC); (iii) The assumption of the first order Markov process; But, the following changes are made: (i) Monthly mean PE, E, runoff, total soil moisture change were taken directly from RR ; Potential Recharge is defined as PR=Smax-S ; where Smax is the maximum total soil moisture for a given calendar month; S is the total soil moisture at the beginning of the month; Potential precipitation is assumed to be the maximum P for a given calendar month; (ii) The AWC and assumption of two soil layers are no longer needed. Normalization is recalibrated. • For the PNW the PDSI(RR) shows detailed orographical features that the PDSI(Palmer) from the Climate Division Data misses. • For the Southern Plains, the PDSI(Palmer) only indicates mild drought (below -1) while the PDSI(RR) is below -2 (moderate and severe drought).