Download
1 / 18
190 likes | 368 Views
The Theory of Consumer Behavior. Basic Conditions: A World of ScarcityRational Individuals with Well Defined PreferencesWell Defined ConstraintsTranslating Preferences into a Diagram --Indifference CurvesWhat assumptions about behavior underlie the Indifference Curve?What does this imply a

E N D
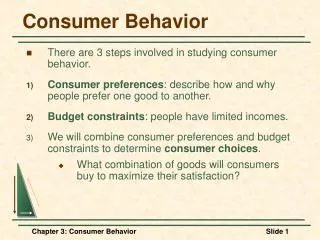
1. Consumer Behavior
2. The Theory of Consumer Behavior Basic Conditions:
A World of Scarcity
Rational Individuals with Well Defined Preferences
Well Defined Constraints
Translating Preferences into a Diagram --
Indifference Curves
What assumptions about behavior underlie the Indifference Curve?
What does this imply about the curve? What does it look like?
3. Properties of Indifference Curves Ranking:
All possible combinations of goods are possible
Implication for Indifference Curve: Curves fill up the consumption space
Transitivity
Consistency in preferences: If A is preferred to B and B preferred to C, then A is preferred to C
Implication for Indifference Curve: Indifference Curves do not cross
Nonsatiation
More is preferred to less
Implication for Indifference Curve: Indifference Curves are negatively sloped
Convexity (to the origin)
Diminishing Marginal Utility of consumption
Implication for Indifference Curve: slope declines as quantity increases
4. Indifference Curves
5. The Budget Constraint
8. The Basics of Indifference Curve Analysis Characteristics of:
Indifference Curves
The Budget LIne
Optimization Behavior
Utility Maximization: Making yourself as well off as possible
What does this mean in the Indifference Curve Framework?
Consumer Equilibrium
MRS= Relative Price Ratio (=-P1/P2)
Changes in the Consumer Equilibrium:
Income Changes
Price Changes
Substitution and Income Effects
9. Consumer Equilibrium
10. Showing a Price Change
11. Showing a Price Change
12. Income and Substitution Effects
13. Illustrating the Use of Indifference Curve Analysis Problem:
Suppose that Fred buys (only) turnips and tea, and that Fred has $20 per week to spend on these items. The price of turnips is $2 per bunch and tea costs $5 per box.
Draw and explain the indifference curve and budget line that illustrates a consumer equilibrium for Fred.
Questions:
What is the value of the MRS for Fred at equilibrium? (Be consistent with your diagram)
Now consider what happens when the government taxes tea at a rate sufficient to lead to a tax of $3 per box. What happens to the consumer equilibrium? Does this change if turnips are an inferior good?
14. Illustrating the Problem The budget line illustrates Fred�s consumption space. Since he has $20 spend, his budget constraint is $2*Turnips + $5*Tea = $20. At the equilibrium, the MRS must equal the relative price ratio. In this case, the relative price ratio is -Ptea/Pturnips or -5/2 or -2.5. This is the value of the MRS at point E, the consumer equilibrium.
15. Taxing Tea The diagram cannot show what kind of goods tea and turnips are since we only have a price change and not an income change. We need to resort to a decomposition of the price change to show this.
16. Substitution and Income Effects This shows the decomposition of the price change. Note that the dashed budget line is an artificial construct, which is parallel to the after tax budget line facing Fred, but on the original indifference curve. The tax changes relative prices, shown by the change from the original budget line to the dashed line. The Substitution effect is the change from E1 to E3 on I0.
17. Substitution and Income Effects (cont.) The income effect can be shown by the shift (inward) of the budget line to the lower line which allows Fred to by 2.5 boxes of tea. The Income effect is the move from E3 to E2. Both goods are shown as normal goods, since the consumption of both fell when income went down. Turnips can be seen as an inferior good if the new consumer equilibrium were at point E4.
18. Demand Curves Deriving Demand Curves from Indifference Curves
Law of Demand
Ceteris Paribus Assumption
Shifts in Demand Curves
A Change in Demand
Movements along a Demand Curve
A Change in Quantity Demanded
Elasticity
Price
Income
Cross Price
Market Demand Curves
Consumer Surplus