Download
1 / 25
250 likes | 332 Views
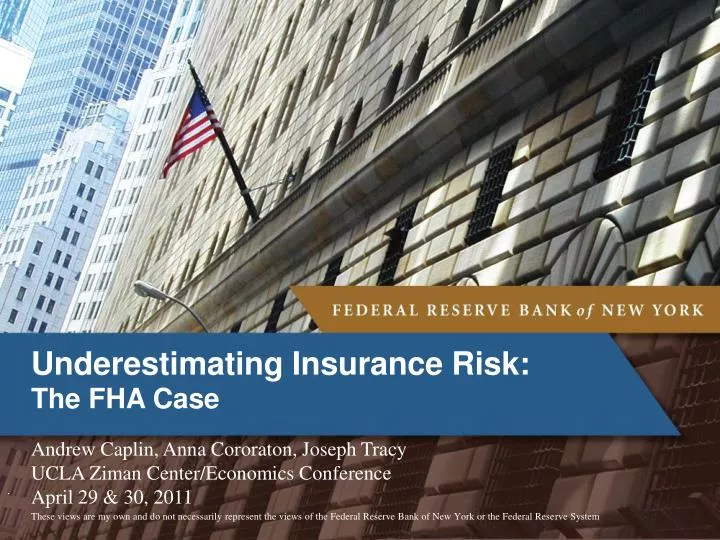
Underestimating Insurance Risk: The FHA Case. . These views are my own and do not necessarily represent the views of the Federal Reserve Bank of New York or the Federal Reserve System. Andrew Caplin, Anna Cororaton, Joseph Tracy UCLA Ziman Center/Economics Conference April 29 & 30, 2011.

E N D
Underestimating Insurance Risk:The FHA Case . These views are my own and do not necessarily represent the views of the Federal Reserve Bank of New York or the Federal Reserve System Andrew Caplin, Anna Cororaton, Joseph Tracy UCLA Ziman Center/Economics Conference April 29 & 30, 2011
Subtitle Text • FHA is intended to be self-financing • Each FHA mortgage carries a credit guarantee • FHA’s Mutual Mortgage Insurance Fund (MMIF) covers any credit losses • minimum capital of 2% of insurance-in-force • FHA charges borrowers guarantee fees which fund the MMIF • up-front fee which is typically financed in the balance • annual fee • Annual external audit of MMIF to assess funding level • Conducted by Integrated Financial Engineering (IFE) • 2010 audit - $2.72b, which is below the 2% level X-Axis Text Contact Person Text Note Text
Subtitle Text IFE uses competing risk model to assess expected default rate on FHA portfolio • Prepay: • house sold • mortgage refinanced to non-FHA • mortgage refinanced to new FHA Mortgage Event Analysis: Mortgage Origination Default: X-Axis Text Contact Person Text Note Text
Subtitle Text IFE uses competing risk model to assess expected default rate on FHA portfolio • Prepay: • house sold (credit risk ends) • mortgage refinanced to non-FHA • (credit risk ends) • mortgage refinanced to new FHA • (credit risk continues) Mortgage Event Analysis: Mortgage Origination Default: (credit risk realized) X-Axis Text Contact Person Text Note Text
Subtitle Text IFE uses competing risk model to assess expected default rate on FHA portfolio • Prepay: • house sold (credit risk ends) • mortgage refinanced to non-FHA • (credit risk ends) Insurance Event Analysis: Mortgage Origination Internal FHA refinance Default: (credit risk realized) Insurance events can span multiple FHA mortgages – covers the span of time that credit risk exists between the borrower and the FHA X-Axis Text Contact Person Text Note Text
Subtitle Text • CoreLogic Linked FHA Data: • FHA originations from 2007 to 2010 Q3 • For each FHA origination that was a refinance, CoreLogic searched its deeds records to see if there was a preceding FHA mortgage. • Currently, our linked FHA data are only 2 mortgages long • CoreLogic is working on extending the chains • CoreLogic also provided a random sample of purchase mortgages and refinances from non-FHA mortgages • Built a random sample by working backwards in time • For 2010, randomly select a k% sample based on FHA published data on each origination type • If we select in a linked FHA refinance, we bring in its prior FHA mortgage as well • Repeat for 2009, 2008 and 2007 – adjust the count of each type of origination that we need based on FHA linked loans that have been pulled in for that year • Selected the largest value of k where we did not run short of any type or origination in any year – 4.5% sample X-Axis Text Contact Person Text Note Text
Subtitle Text Contrasting FHA performance based on mortgage or insurance events Active: 72% Prepaid: 20% Default: 8% X-Axis Text Contact Person Text Note Text
Subtitle Text Contrasting FHA performance based on mortgage or insurance events Active: 72% Prepaid: 20% Default: 8% Active: 83% Prepaid: 8% Default: 9% X-Axis Text Contact Person Text Note Text
Subtitle Text What are implications of switching from a mortgage event to an insurance event analysis for expected default rate of active FHA mortgages? Estimate a competing risk model with common data, specifications and switch between mortgage event and insurance event data structure X-Axis Text Contact Person Text Note Text
Subtitle Text What are implications of switching from a mortgage event to an insurance event analysis for expected default rate of active FHA mortgages? Use the hazard estimates to calculate expected prepayment and default probabilities over a 5-year horizon – S(t) is estimated joint survivor X-Axis Text Contact Person Text Note Text
Subtitle Text How should we define the “default” event? • Claim on FHA takes place long after the initial delinquency • Variability of these time lags will make it difficult to estimate effect of time-varying determinants of default X-Axis Text Contact Person Text Note Text
Subtitle Text How should we define the “default” event? • Reducing the variance by selecting earlier delinquency triggers also reduces the conditional probability of a claim given that a mortgage hits that delinquency trigger • 90-days delinquent provides a reasonable tradeoff X-Axis Text Contact Person Text Note Text
Subtitle Text Determinants of Prepayment and Default: • Loan-specific factors: • LTV (dynamic) • Credit score [FICO] • DTI • Loan purpose • Documentation level • ARM & term X-Axis Text Contact Person Text Note Text
Subtitle Text Determinants of Prepayment and Default: • Loan-specific factors: • LTV (dynamic) • Credit score [FICO] • DTI • Loan purpose • Documentation level • ARM & term • State-specific factors: • Judicial foreclosure • Recourse X-Axis Text Contact Person Text Note Text
Subtitle Text Determinants of Prepayment and Default: • Loan-specific facors: • LTV (dynamic) • Credit score [FICO] • DTI • Loan purpose • Documentation level • ARM & term • State-specific factors: • Judicial foreclosure • Recourse • Economic: • MSA unemployment (dynamic) • House price change – 12 months (dynamic) • Distress sales (dynamic) • Interest rate differential [prepayment only] (dynamic) • Percent change in monthly payment [internal FHA refi] X-Axis Text Contact Person Text Note Text
Subtitle Text Hazard Estimates: LTV on prepayment X-Axis Text Contact Person Text Note Text
Subtitle Text Hazard Estimates: LTV on default X-Axis Text Contact Person Text Note Text
Subtitle Text Hazard Estimates: FICO X-Axis Text Contact Person Text Note Text
Subtitle Text Hazard Estimates: Debt-to-income X-Axis Text Contact Person Text Note Text
Subtitle Text Hazard Estimates: economic environment X-Axis Text Contact Person Text Note Text
Subtitle Text Hazard Estimates: baseline prepayment hazard X-Axis Text Contact Person Text Note Text
Subtitle Text Hazard Estimates: baseline default hazard X-Axis Text Contact Person Text Note Text
Subtitle Text Forecasted Performance for active FHA mortgages: 5-year horizon Active: 19.6% Prepaid: 69.6% Default: 10.8% X-Axis Text Contact Person Text Note Text
Subtitle Text Forecasted Performance for active FHA mortgages: 5-year horizon Active: 19.6% Prepaid: 69.6% Default: 10.8% Active: 69.2% Prepaid:15.3% Default: 15.5% X-Axis Text Contact Person Text Note Text
Subtitle Text Forecasted Performance: by vintage X-Axis Text Contact Person Text Note Text